Fig. 2
Download original image
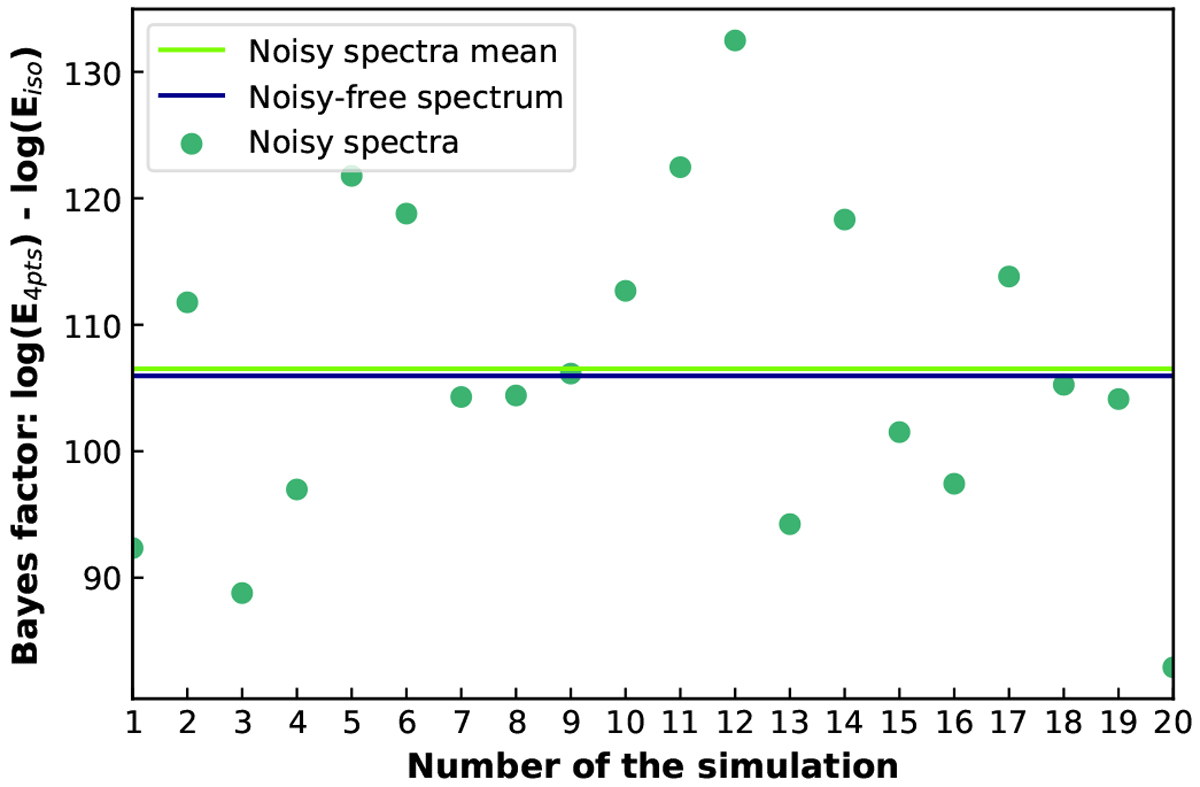
Logarithmic Bayes factor for a four-point TP profile vs. an isothermal profile. The figure shows in blue the value obtained with nonrandomized spectra, and green dots represent the 20 values for normally distributed noisy spectra (30 ppm standard deviation). The logarithmic Bayes factor averaged on the 20 simulations is shown in light green. The nonrandomized logarithmic Bayes factor and its noisy average counterpart are almost identical, proving that our study can be based on nonrandomized spectra.
Current usage metrics show cumulative count of Article Views (full-text article views including HTML views, PDF and ePub downloads, according to the available data) and Abstracts Views on Vision4Press platform.
Data correspond to usage on the plateform after 2015. The current usage metrics is available 48-96 hours after online publication and is updated daily on week days.
Initial download of the metrics may take a while.