Fig. 11
Download original image
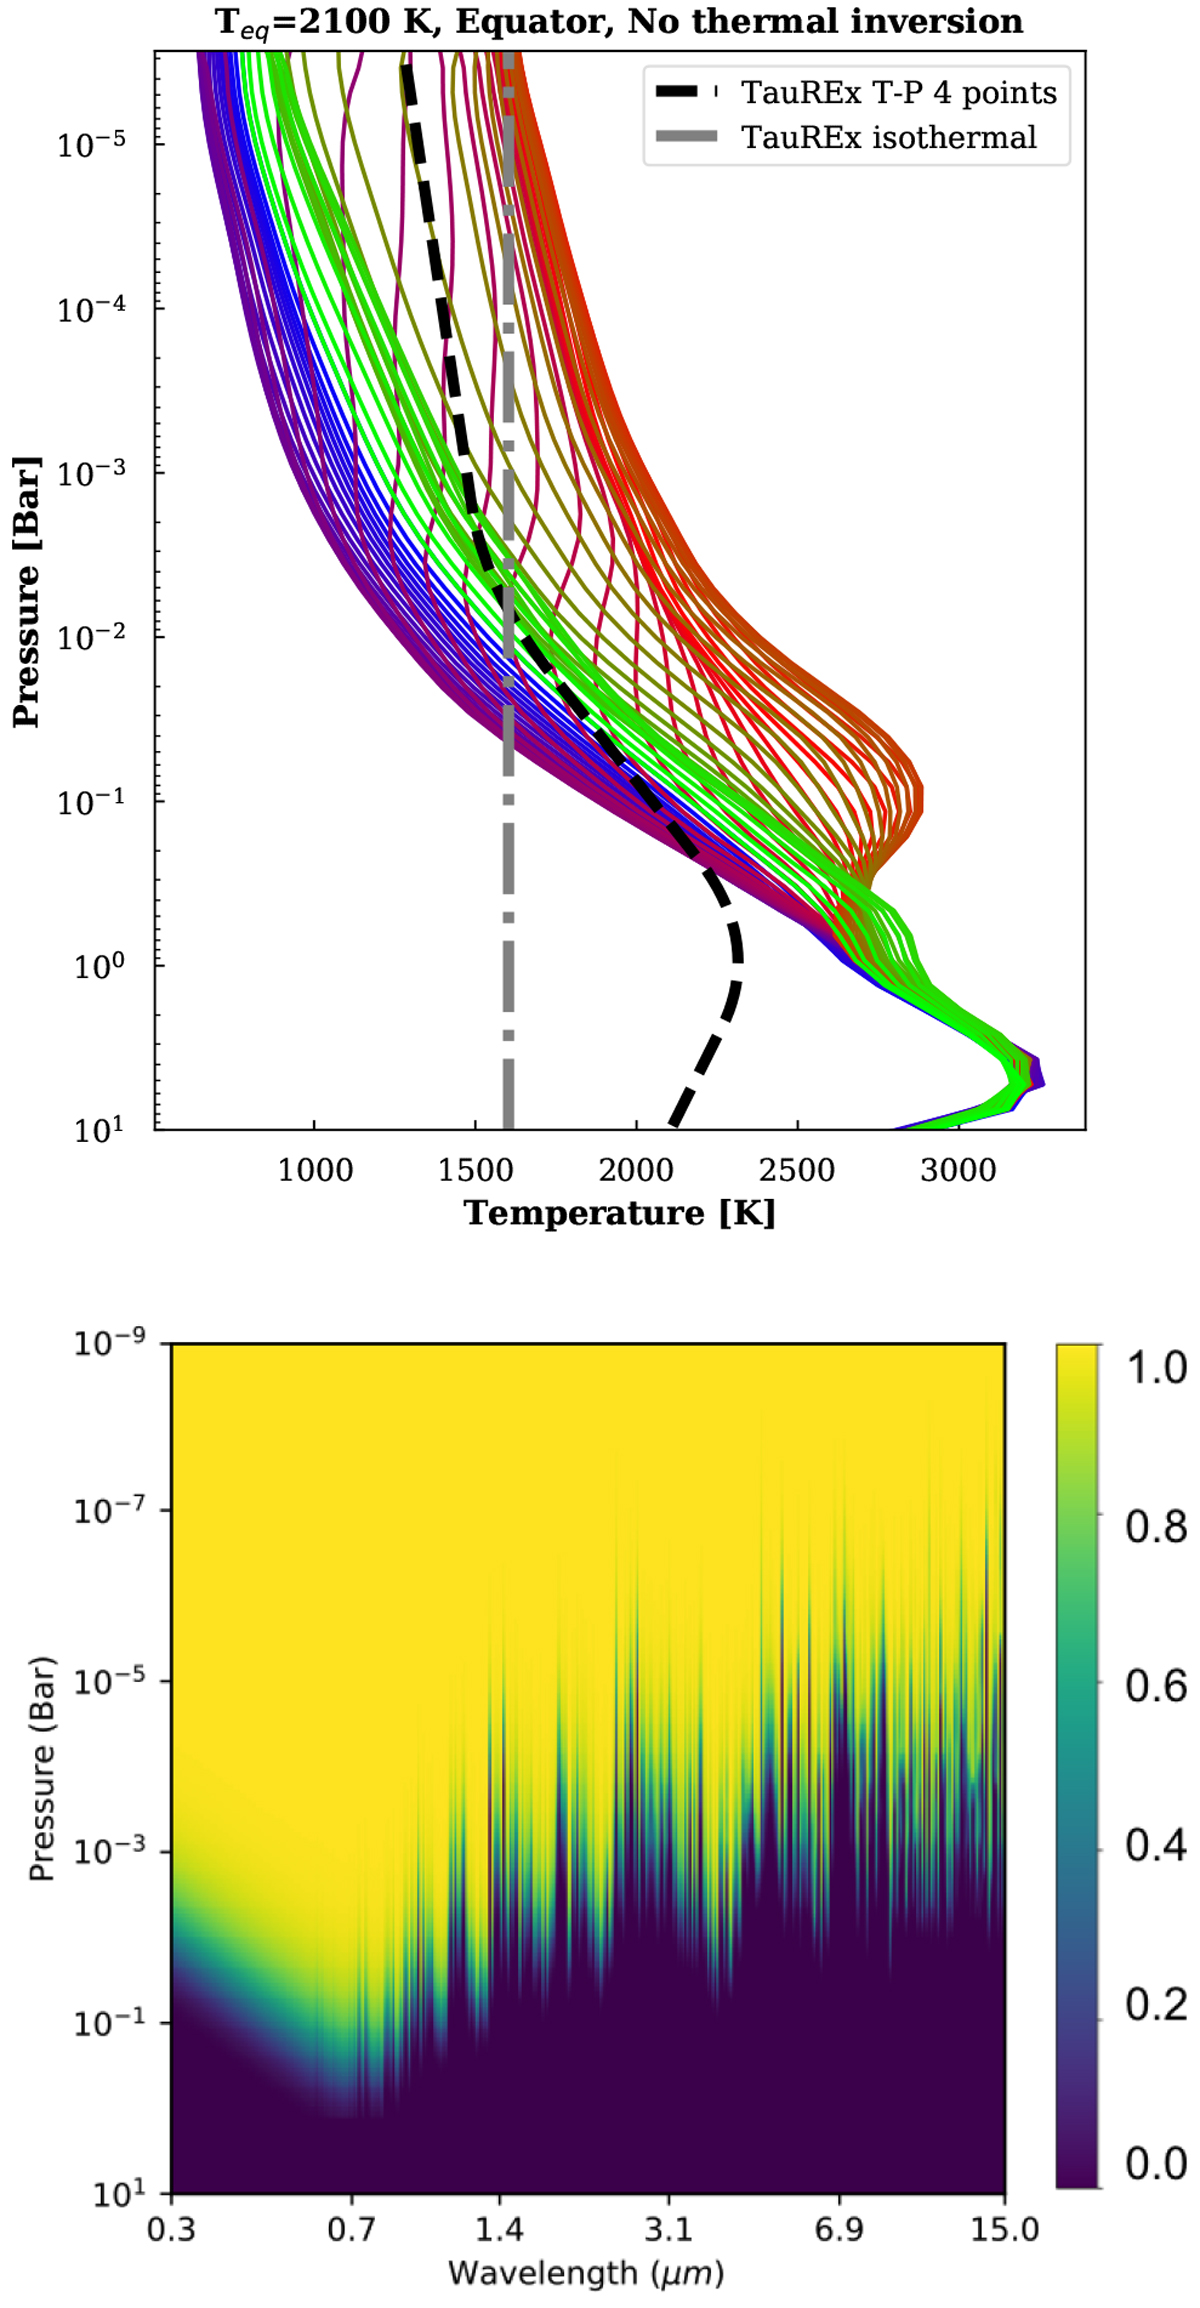
Top: equatorial thermal profiles from the no thermal inversion Teq = 2100 K simulation. Each color represents a longitude from antistellar (blue) to substellar (red). Profiles near the terminator and probed by transmission are green. The dotted gray (isothermal) and dashed black lines are the retrieved profiles. Bottom: transmittance map (color bar from 0 to 1) for each wavelength at each pressure.
Current usage metrics show cumulative count of Article Views (full-text article views including HTML views, PDF and ePub downloads, according to the available data) and Abstracts Views on Vision4Press platform.
Data correspond to usage on the plateform after 2015. The current usage metrics is available 48-96 hours after online publication and is updated daily on week days.
Initial download of the metrics may take a while.