Fig. 1
Download original image
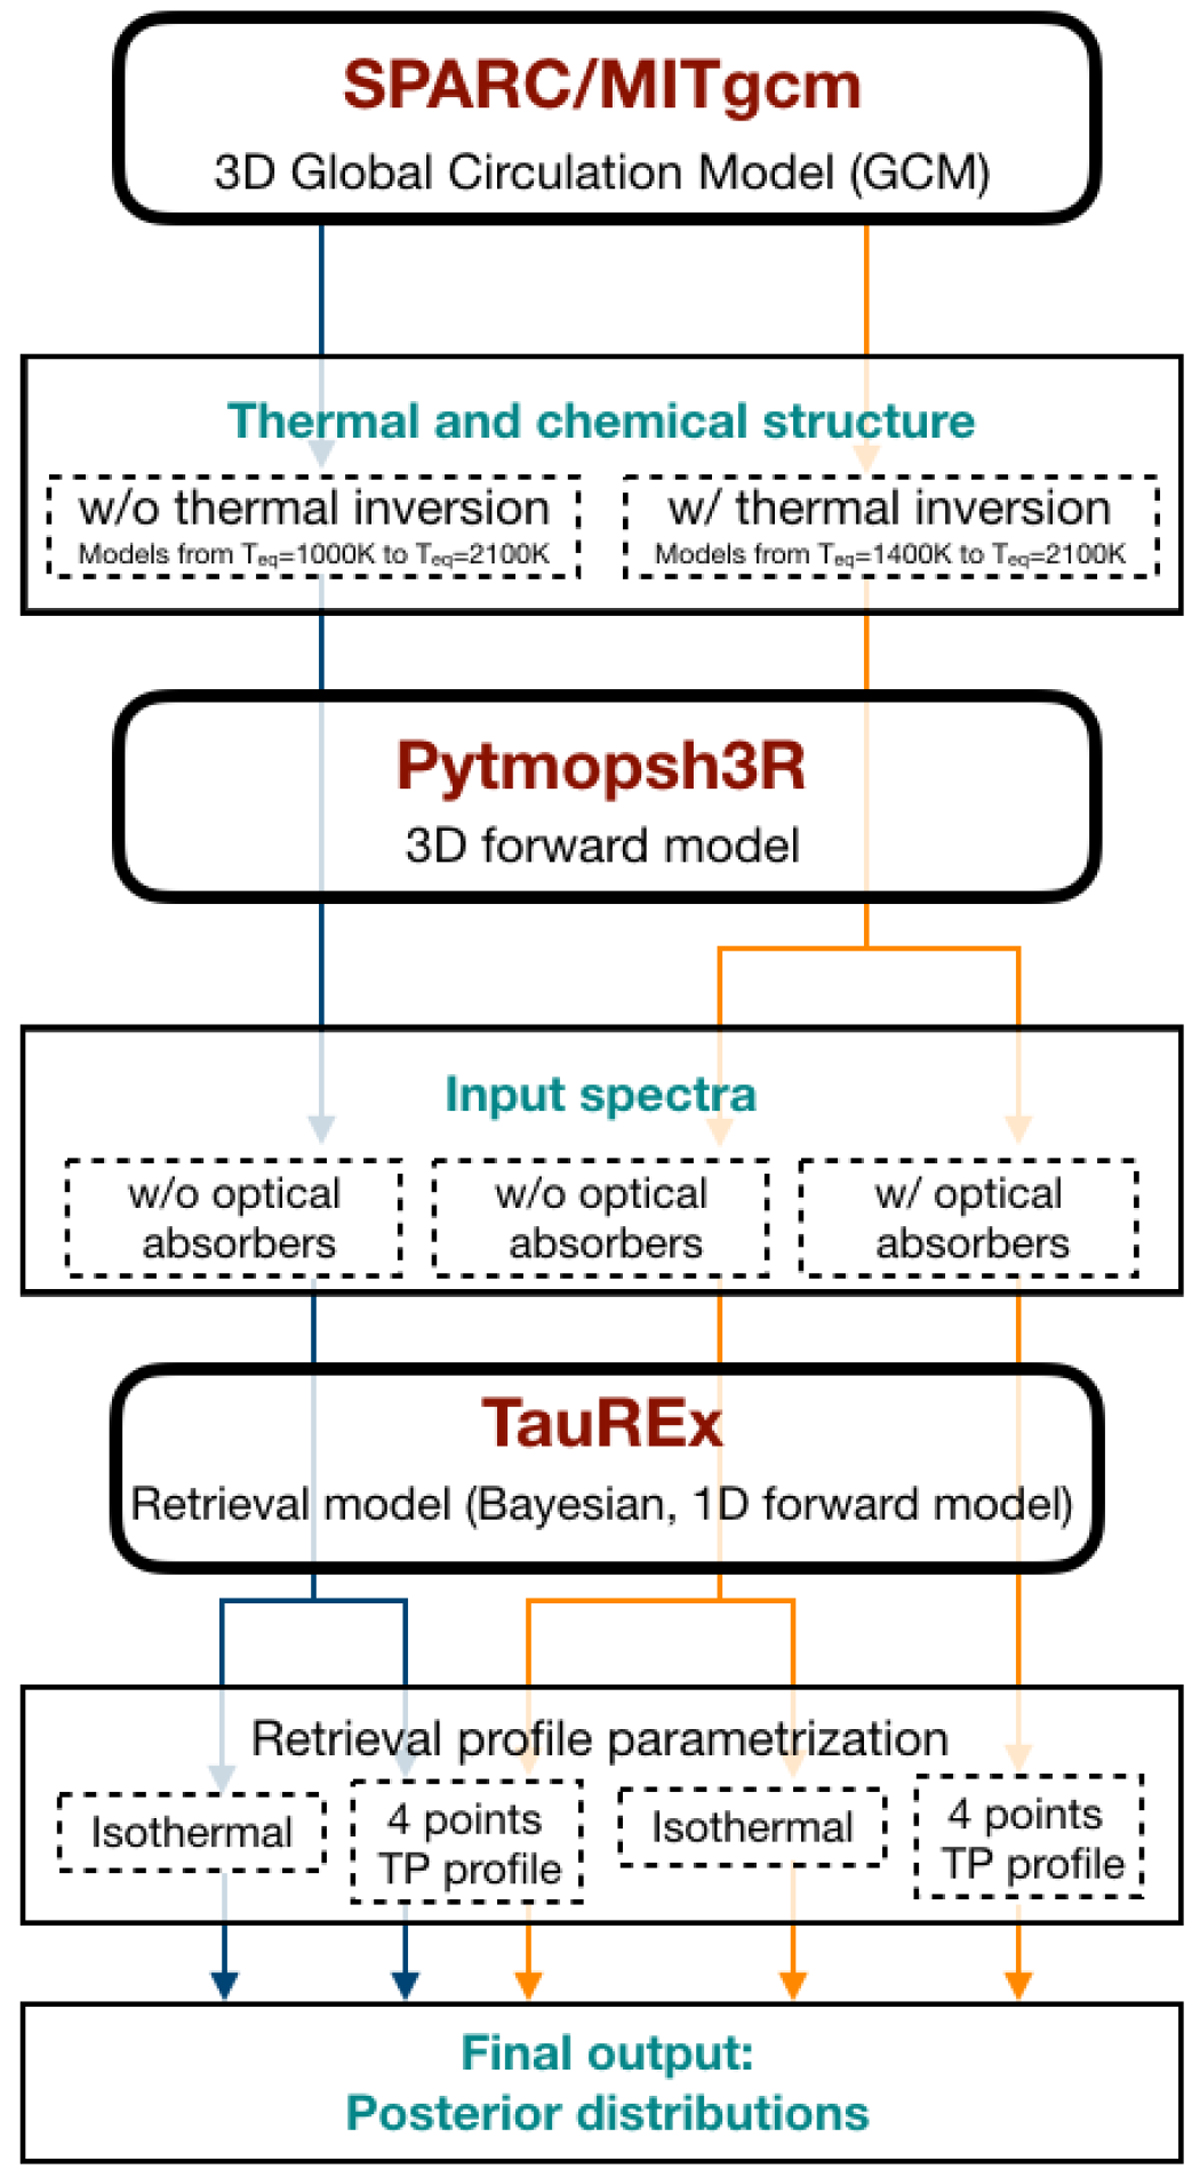
Flowchart of the numerical experiment. The three models are shown in red, the outputs are indicated in green-blue, and the parameters are presented in black. There are two main sets of simulations from the GCM SPARC/MIT, with and without thermal inversion. This is indicated with the orange and the blue arrows, respectively. The final output consists of five sets of posterior distributions.
Current usage metrics show cumulative count of Article Views (full-text article views including HTML views, PDF and ePub downloads, according to the available data) and Abstracts Views on Vision4Press platform.
Data correspond to usage on the plateform after 2015. The current usage metrics is available 48-96 hours after online publication and is updated daily on week days.
Initial download of the metrics may take a while.