Fig. 9
Download original image
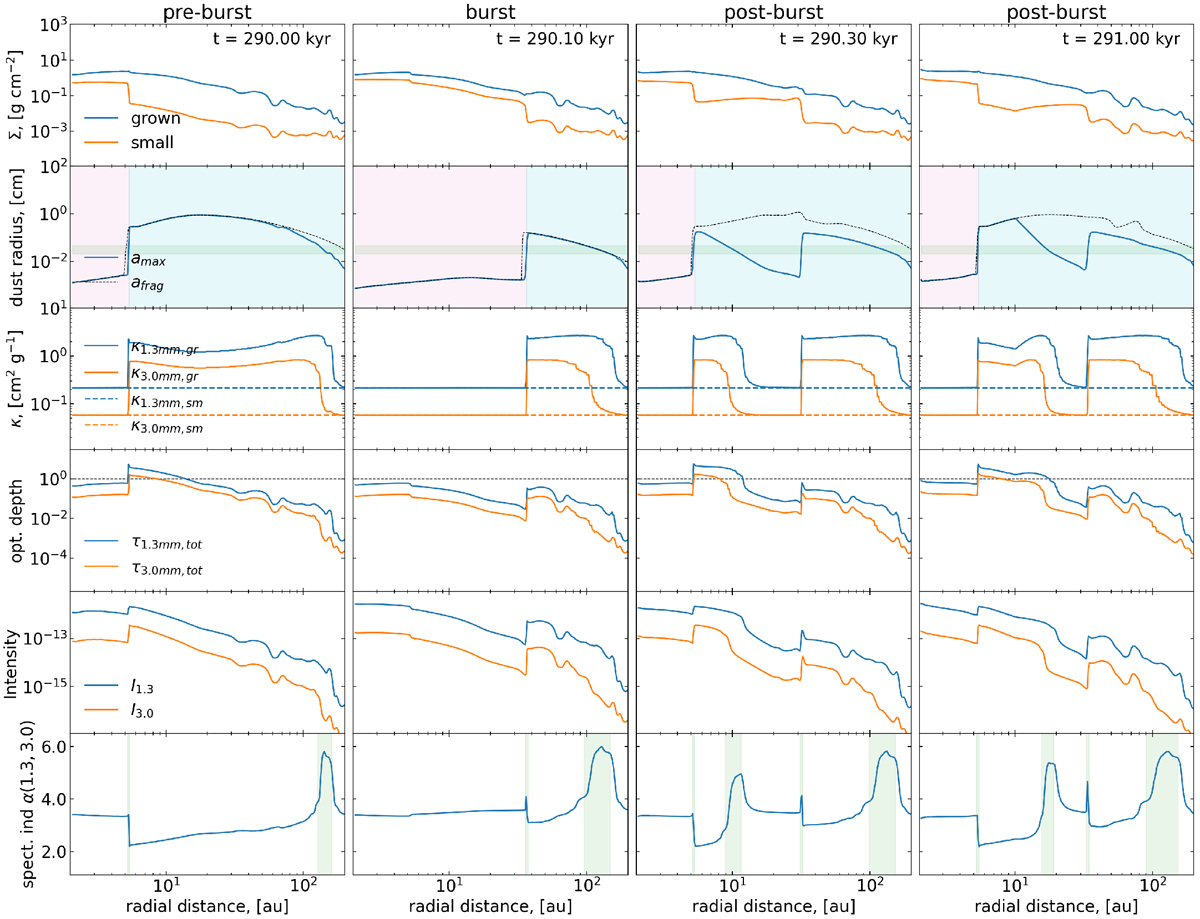
Azimuthally averaged disk characteristics before, during, and after the burst. Columns from left to right correspond to the time just before the burst onset (290.0 kyr), just before the end of the burst (290.1 kyr), 200 yrs after the end of the burst (290.3 kyr), and 900 yr after the end of the burst (291 kyr). Rows from top to bottom show the azimuthally averaged surface densities of small and grown dust, maximum dust size, absorption opacities of small and grown dust at 1.3 mm and 3.0 mm, optical depths at 1.3 mm and 3.0 mm, intensity of dust thermal emission at 1.3 and 3.0 mm (in ergs cm−2 s−1 Hz−1 St−1), and spectral index α1.3−3.0. The pink and blue areas in the second row indicate the disk regions without and with water ice, respectively; the boundary between them is the current position of the water snowline. The black dotted line in the second row shows the fragmentation barrier afrag. The horizontal green strip in the second row is confined by 1.3 mm∕(2π) and 3.0 mm∕(2π). The crossingof this strip with the amax curve defines the disk regions where the maximum dust size lies in the 1.3 mm ∕(2π) < amax < 3.0 mm∕(2π) limits. Theseregions are also characterized by local peaks or drops in α(λ1, λ2) highlighted by the vertical green strips in the bottom row. The horizontal black dotted line in the fourth row shows the optical depth of 1.0 for convenience.
Current usage metrics show cumulative count of Article Views (full-text article views including HTML views, PDF and ePub downloads, according to the available data) and Abstracts Views on Vision4Press platform.
Data correspond to usage on the plateform after 2015. The current usage metrics is available 48-96 hours after online publication and is updated daily on week days.
Initial download of the metrics may take a while.