Fig. 6
Download original image
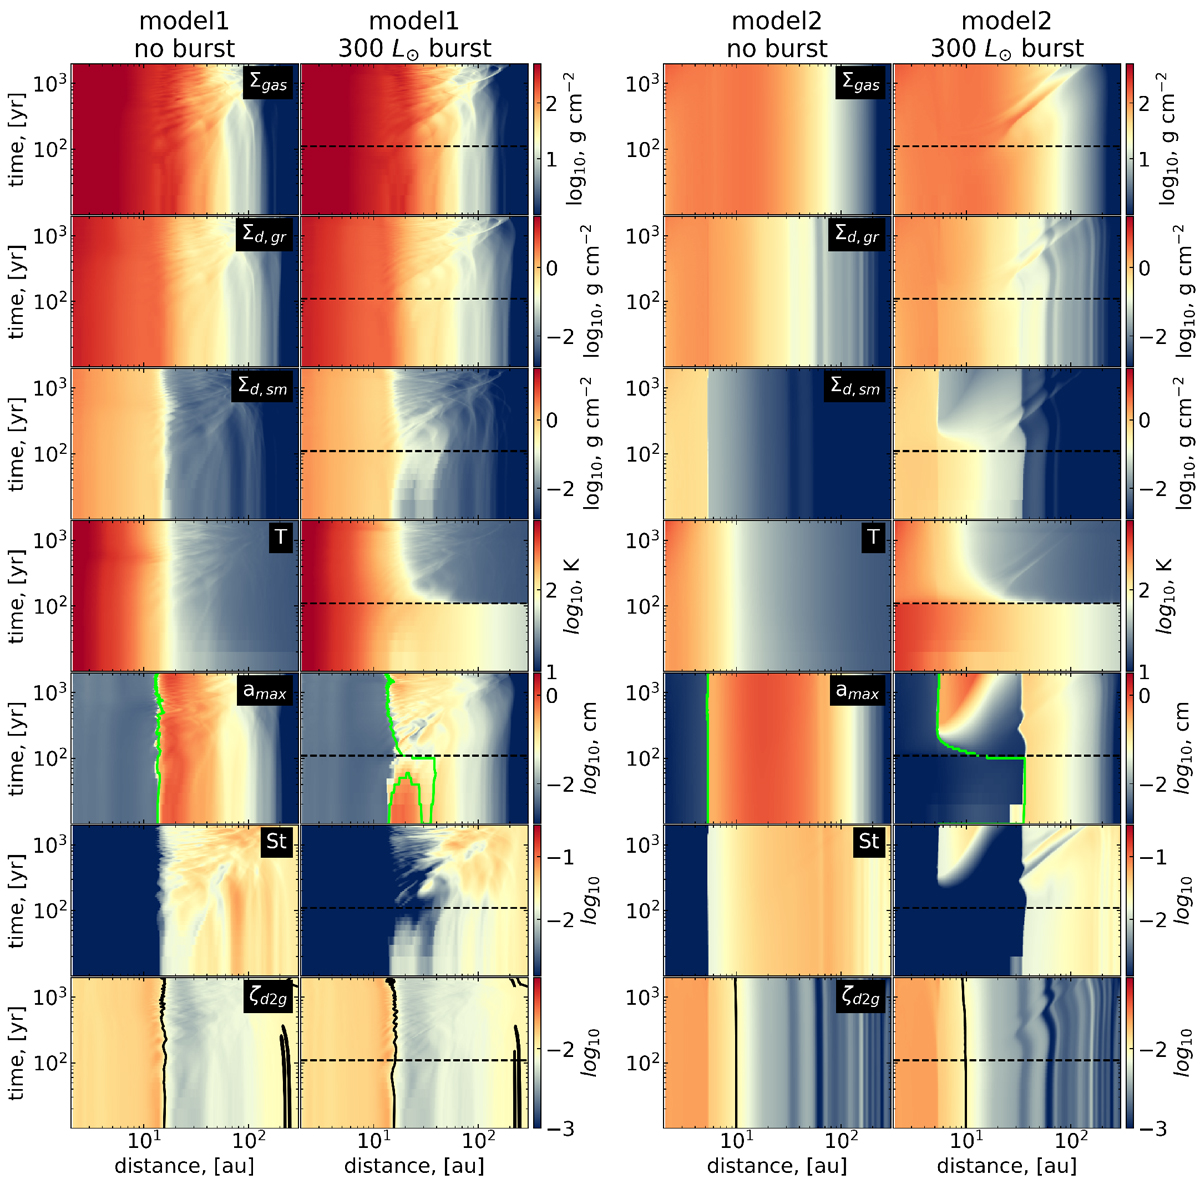
Temporal evolution of the azimuthally-averaged disk characteristics for model 1 with the early ignition of the burst (left-hand side duplet of columns) and model 2 with the late ignition (right-hand side duplet). The time is counted from t = 90 kyr in model 1 and t = 290 kyr in model 2. Each column in the duplets corresponds to the case without burst (left column) and with a burst of L = 300 L⊙ (right column). The columns from top to bottom show the gas surface density, grown dust surface density, small dust surface density, temperature, maximal size of dust grains, Stokes number, and dust-to-gas mass ratio, respectively. The horizontal black dashed lines indicate the terminal time of the burst. The thick green curves in the fifth row outline the position of the water snow line. The black solid curves in the bottom row identify the disk loci with the total dust to gas ratio of 0.01for convenience.
Current usage metrics show cumulative count of Article Views (full-text article views including HTML views, PDF and ePub downloads, according to the available data) and Abstracts Views on Vision4Press platform.
Data correspond to usage on the plateform after 2015. The current usage metrics is available 48-96 hours after online publication and is updated daily on week days.
Initial download of the metrics may take a while.