Fig. 2
Download original image
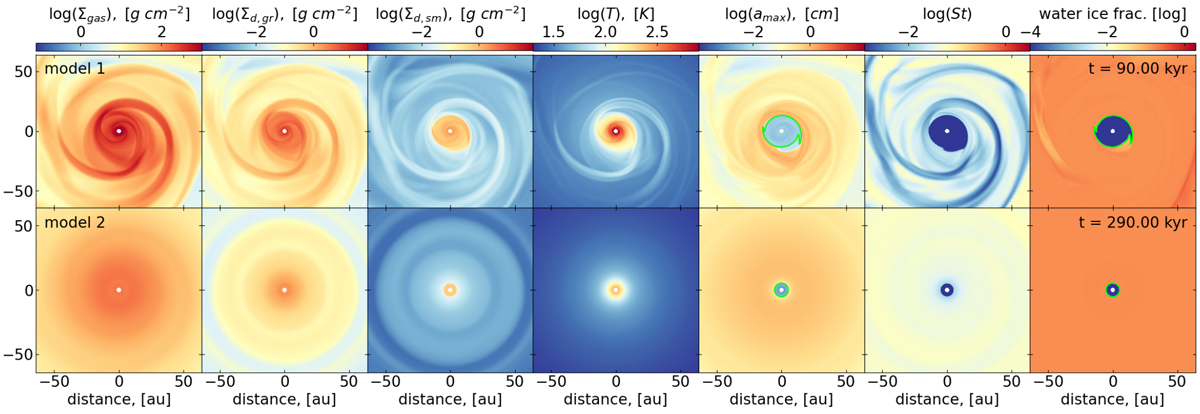
Spatial distributions of various disk characteristics just before the onset of the burst at t = 90 kyr (model 1, top row) and t = 290 kyr (model 2, bottom row) after the disk formation instance. Columns from left to right represent the gas surface density, grown dust surface density, small dust surface density, temperature, maximumdust size, Stokes number, and the mass fraction of water ice on dust grains
![]() , respectively. The green lines outline the position of the H2O snowline.
, respectively. The green lines outline the position of the H2O snowline.
Current usage metrics show cumulative count of Article Views (full-text article views including HTML views, PDF and ePub downloads, according to the available data) and Abstracts Views on Vision4Press platform.
Data correspond to usage on the plateform after 2015. The current usage metrics is available 48-96 hours after online publication and is updated daily on week days.
Initial download of the metrics may take a while.