Free Access
Fig. B.1
Download original image
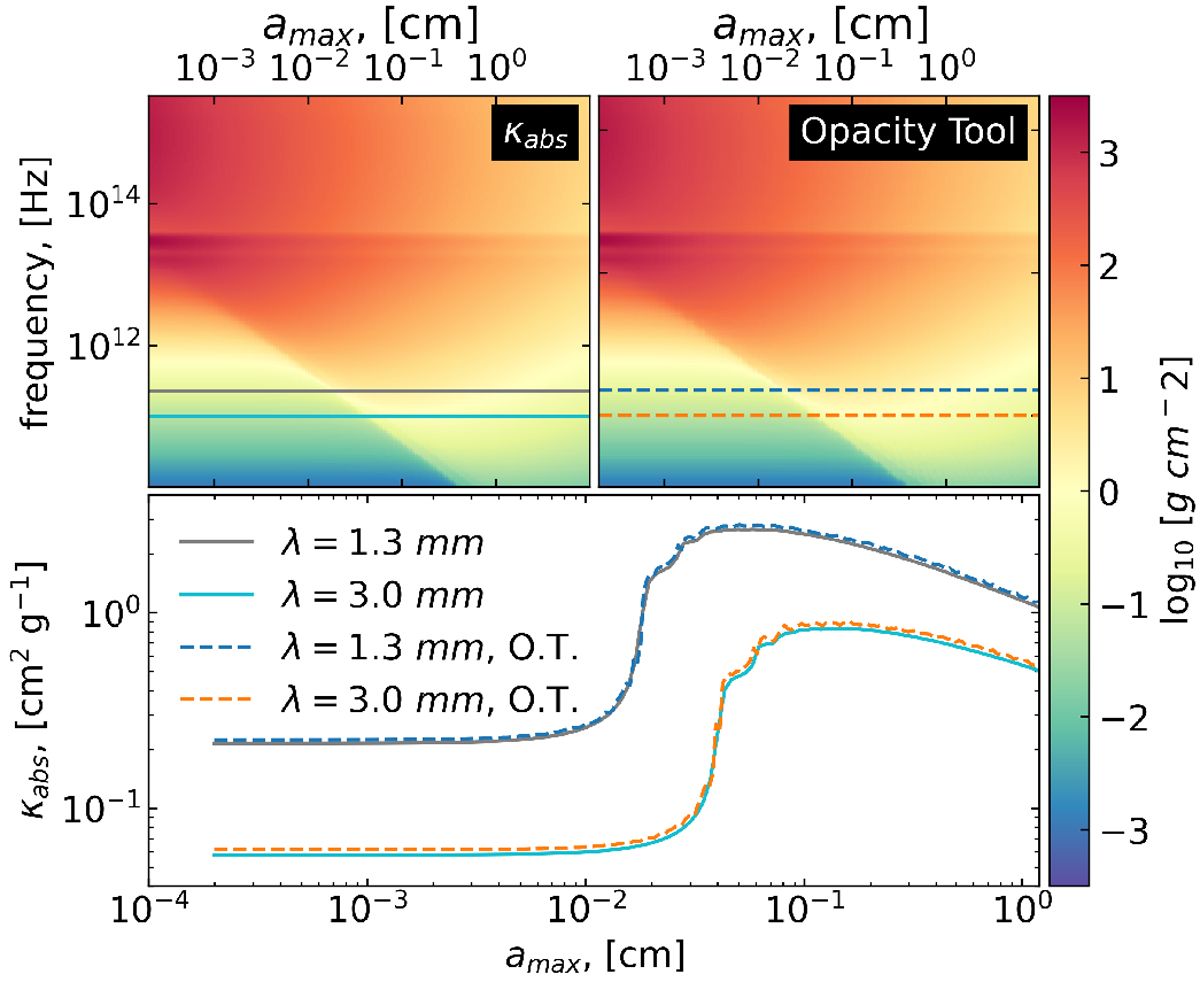
Frequency-dependent dust absorption opacities as a function of dust maximum size. Upper-left panel – data taken from (Skliarevskii et al. 2021); upper-right panel – data taken from (Woitke et al. 2016). A comparison between the two data sets at 1.3 mm and 3.0 mm is provided in the bottom panel.
Current usage metrics show cumulative count of Article Views (full-text article views including HTML views, PDF and ePub downloads, according to the available data) and Abstracts Views on Vision4Press platform.
Data correspond to usage on the plateform after 2015. The current usage metrics is available 48-96 hours after online publication and is updated daily on week days.
Initial download of the metrics may take a while.