Fig. 12
Download original image
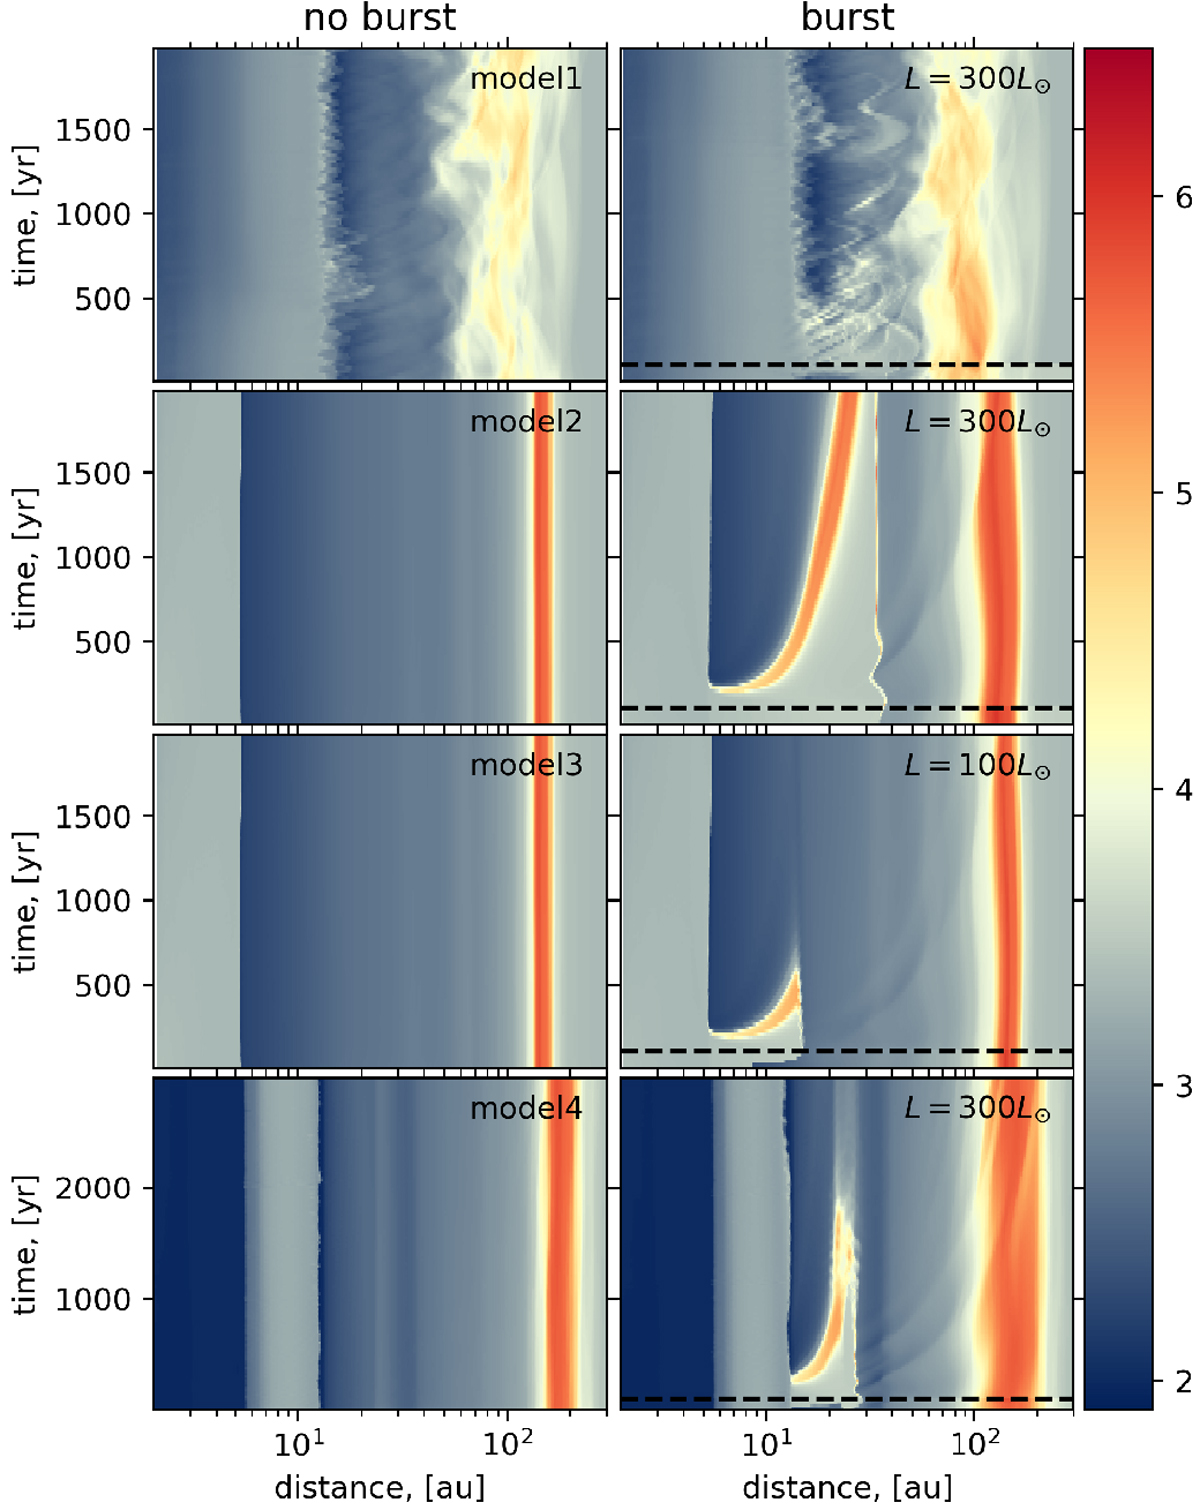
Space-time diagrams showing the time evolution of the azimuthally averaged spectral index
![]() with λ1= 1.3 mm and λ2 = 3.0 mm. Each row corresponds to the indicated model, while the left and right columns show the cases without and with the burst, respectively. The horizontal dashed line in the left column indicates the end of the burst.
with λ1= 1.3 mm and λ2 = 3.0 mm. Each row corresponds to the indicated model, while the left and right columns show the cases without and with the burst, respectively. The horizontal dashed line in the left column indicates the end of the burst.
Current usage metrics show cumulative count of Article Views (full-text article views including HTML views, PDF and ePub downloads, according to the available data) and Abstracts Views on Vision4Press platform.
Data correspond to usage on the plateform after 2015. The current usage metrics is available 48-96 hours after online publication and is updated daily on week days.
Initial download of the metrics may take a while.