Free Access
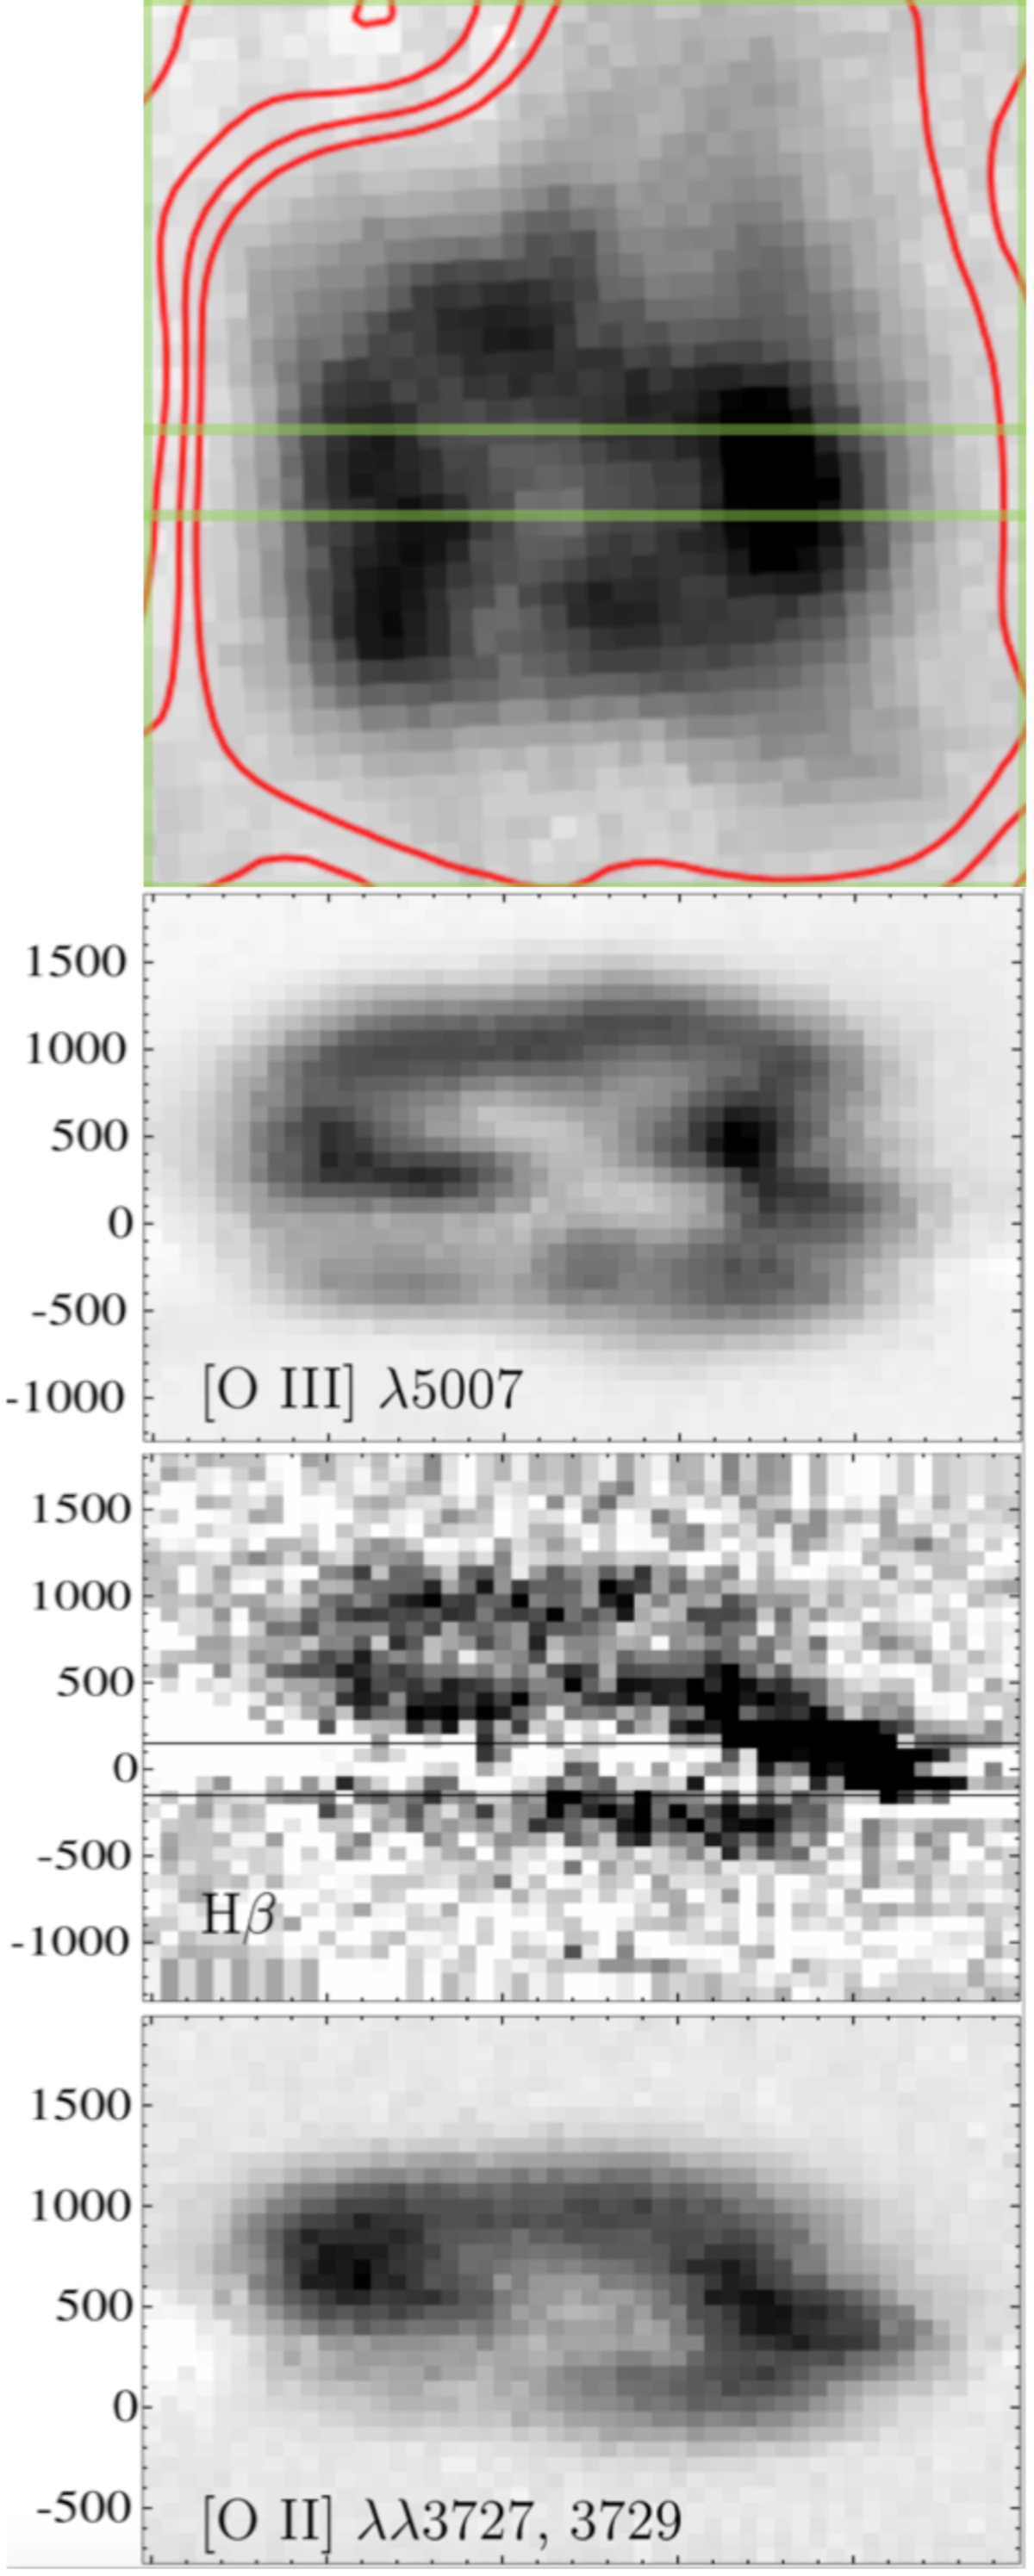
Fig. 9.
Download original image
Same as in Fig. 7, but for slit 1 (cf. Fig. 2), and for a different set of emission lines, as marked in the panels. The spatial extent of the images along the slit is 10″. As for Hα in Fig. 7, the Hβ image is corrupted by subtraction of the uneven LMC background. We note very different structures in [O II] and [O III].
Current usage metrics show cumulative count of Article Views (full-text article views including HTML views, PDF and ePub downloads, according to the available data) and Abstracts Views on Vision4Press platform.
Data correspond to usage on the plateform after 2015. The current usage metrics is available 48-96 hours after online publication and is updated daily on week days.
Initial download of the metrics may take a while.