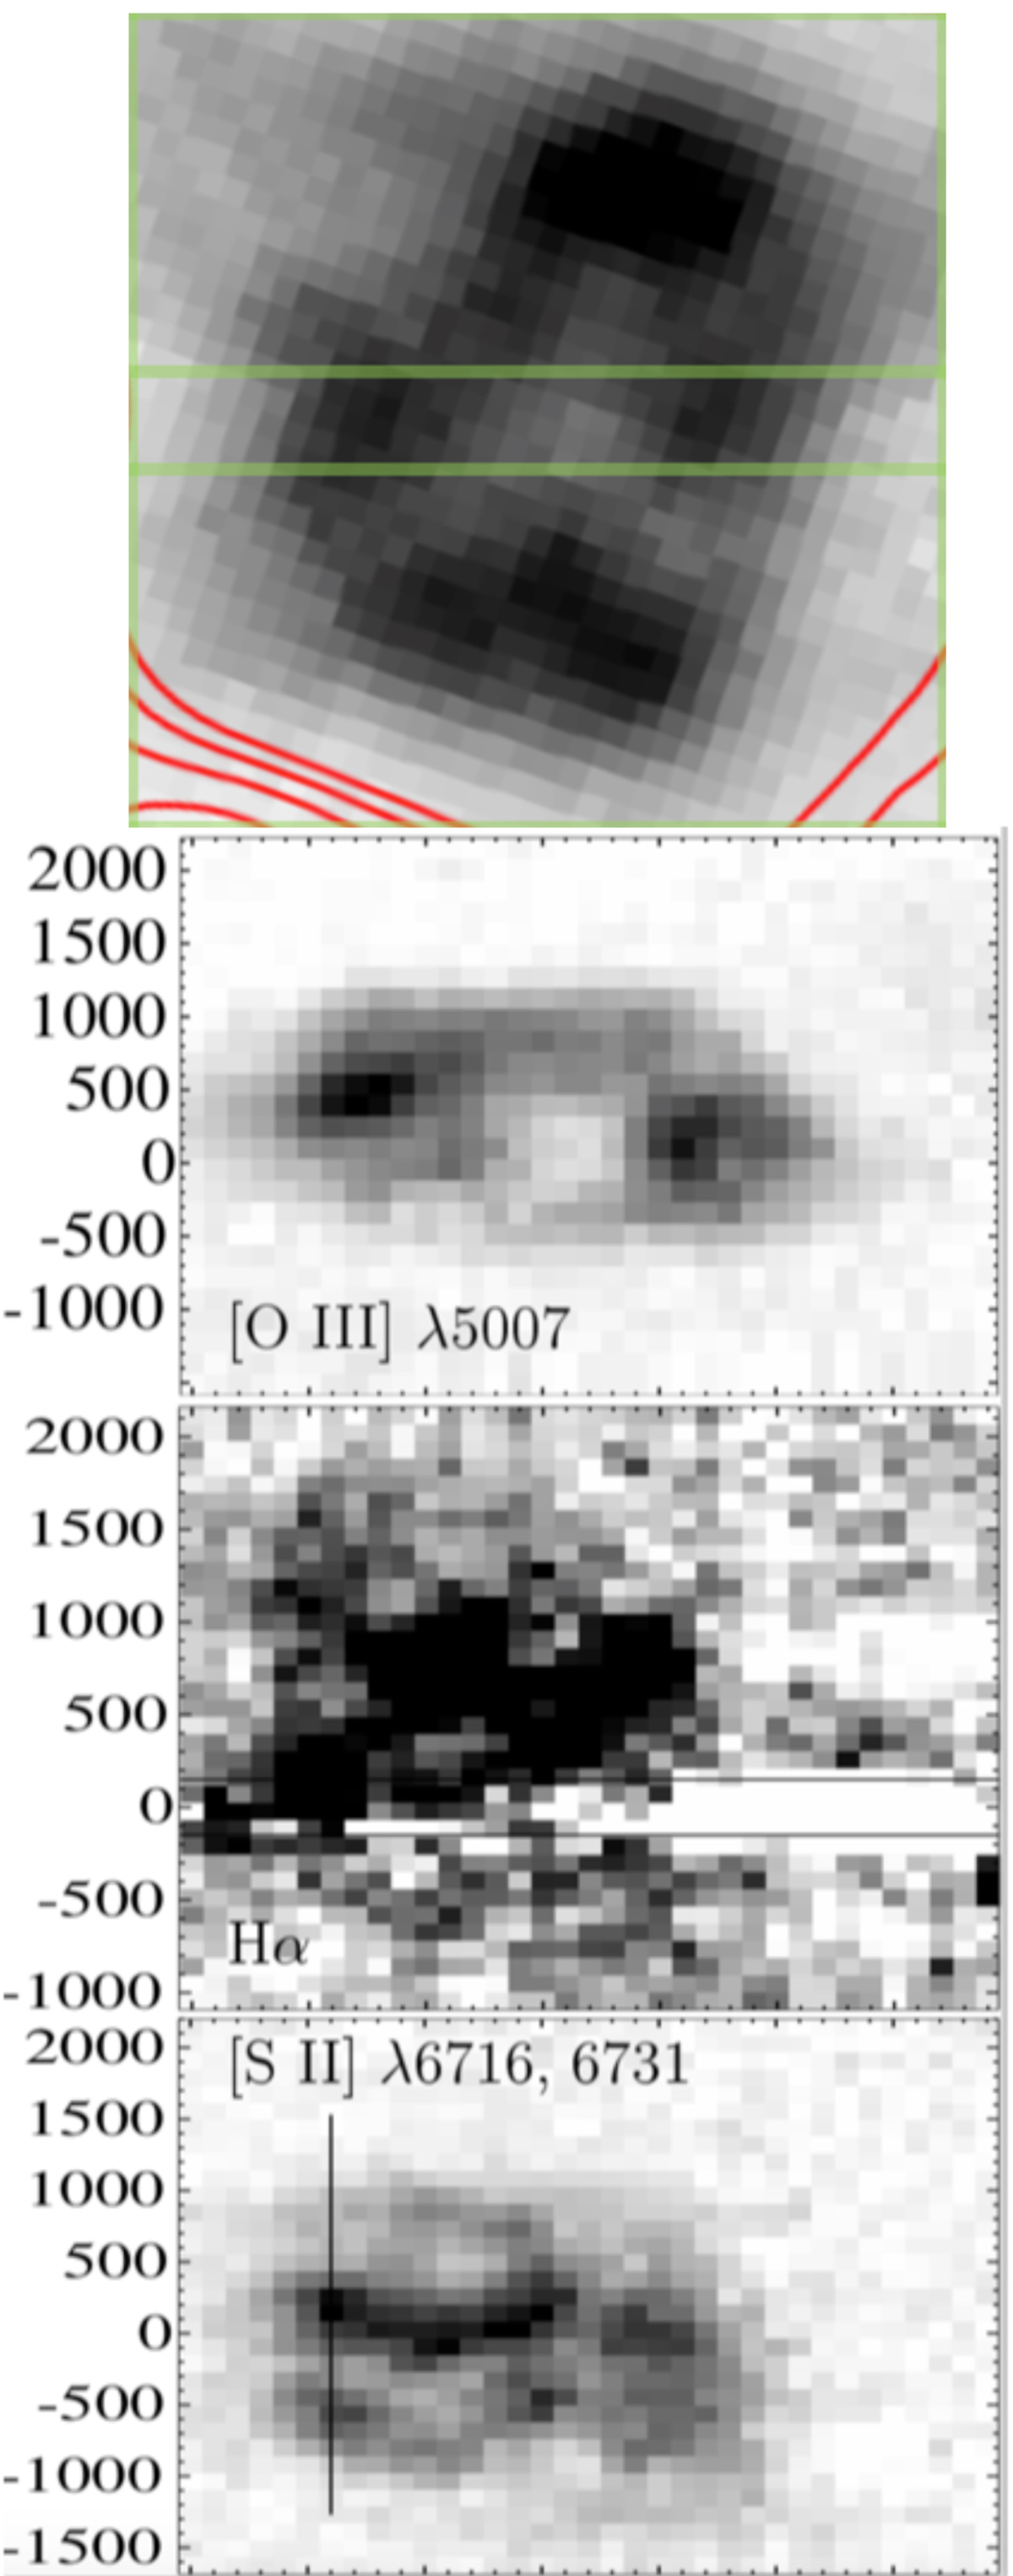
Fig. 7.
Download original image
Top panel: central 8″ × 8″ of SNR 0540-69.3 using the NTT/EMMI difference image with linear intensity scaling in Fig. 6, rotated 68° to match the horizontally marked slit 2. Lower panels: space-velocity images along slit 2 for [O III] λ5007, Hα, and [S II] λλ6716,6731. The vertical and horizontal axes show the velocity (in km s−1, corrected for the LMC redshift) and the spatial coordinate (in arcseconds) along the slit, respectively. The horizontal black lines (for Hα) mark the velocity spread of H II regions in LMC (∼ ± 125 km s−1). The velocity interval affected by the subtraction of the uneven LMC background is somewhat larger because of the finite spectral resolution. Hα is more affected by the background subtraction than other lines, and blended with [N II] λλ6548,6583. The vertical line in the [S II] image is described in Sect. 3.2.
Current usage metrics show cumulative count of Article Views (full-text article views including HTML views, PDF and ePub downloads, according to the available data) and Abstracts Views on Vision4Press platform.
Data correspond to usage on the plateform after 2015. The current usage metrics is available 48-96 hours after online publication and is updated daily on week days.
Initial download of the metrics may take a while.