Fig. 5.
Download original image
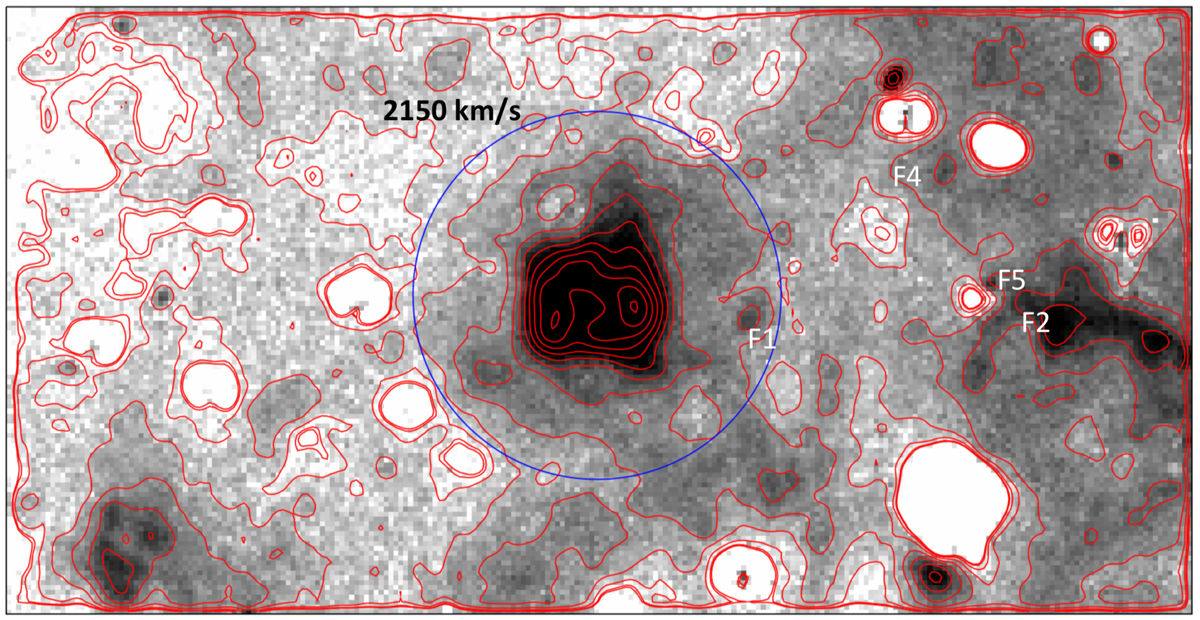
65″ × 33″ difference image between NTT/EMMI/[O III]/0 and NTT/EMMI/[O III]/6000 with square root intensity scaling to bring out faint details. The [O III]/0 image was smoothed to match the slightly worse seeing of the [O III]/6000 image before subtraction. North is up and east is to the left. The image can trace faint [O III] emission to large distances from the pulsar. A blue circle is drawn with radius 10![]() 0, corresponding to ∼ 2150 km s−1 for ejecta coasting freely for 1100 years (or ∼ 1980 km s−1 for 1200 years) at distance of 50 kpc. The filaments F1, F2, F4, and F5, discussed in the text, are marked. Note PWN protrusions to the north, presumably in the pulsar jet direction, and to the southwest, which could be a structure similar to the Crab chimney.
0, corresponding to ∼ 2150 km s−1 for ejecta coasting freely for 1100 years (or ∼ 1980 km s−1 for 1200 years) at distance of 50 kpc. The filaments F1, F2, F4, and F5, discussed in the text, are marked. Note PWN protrusions to the north, presumably in the pulsar jet direction, and to the southwest, which could be a structure similar to the Crab chimney.
Current usage metrics show cumulative count of Article Views (full-text article views including HTML views, PDF and ePub downloads, according to the available data) and Abstracts Views on Vision4Press platform.
Data correspond to usage on the plateform after 2015. The current usage metrics is available 48-96 hours after online publication and is updated daily on week days.
Initial download of the metrics may take a while.