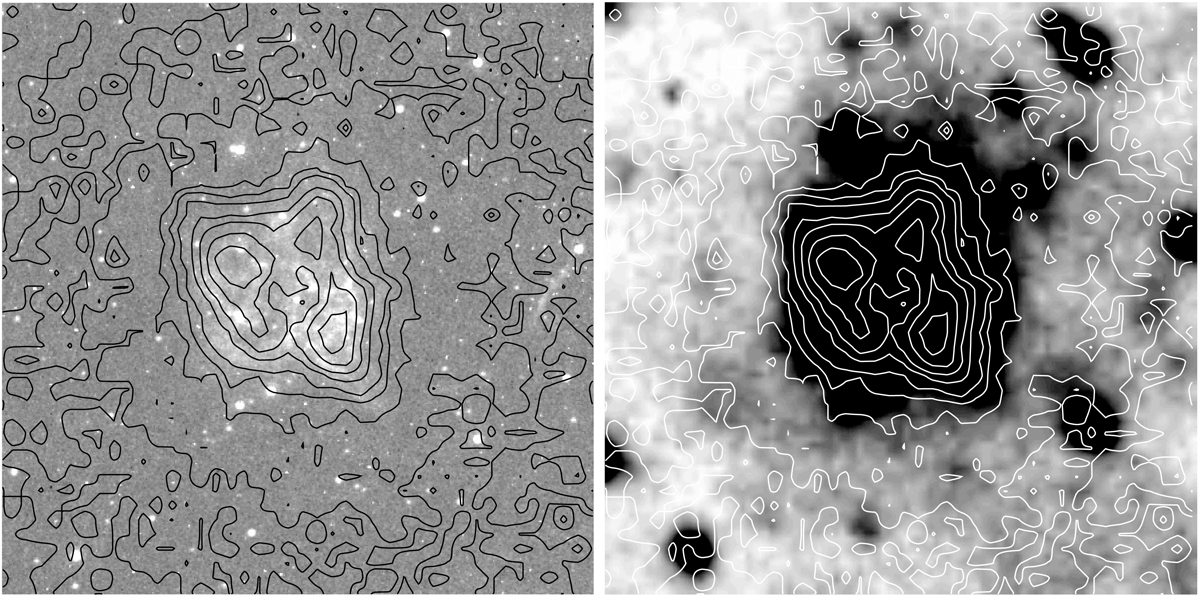
Fig. 4.
Download original image
Central 20″ × 20″ field of 0540 as viewed by HST/WFPC2/F673N (left, positive) and NTT/EMMI/[O III]/0 (right, negative). North is up and east to the left. The contours of the Chandra/ACIS X-ray fluxes in Fig. 2 are overlaid in both images. The spatial distribution of the X-ray emission shows an elongated structure with NW-SE jets, which is associated with the PWN (cf. Serafimovich et al. 2004; Lundqvist et al. 2011). As seen, the [S II] emission dominating in the HST image does not extend outside the PWN, whereas the [O III] glow in the NTT image extends far outside the PWN.
Current usage metrics show cumulative count of Article Views (full-text article views including HTML views, PDF and ePub downloads, according to the available data) and Abstracts Views on Vision4Press platform.
Data correspond to usage on the plateform after 2015. The current usage metrics is available 48-96 hours after online publication and is updated daily on week days.
Initial download of the metrics may take a while.