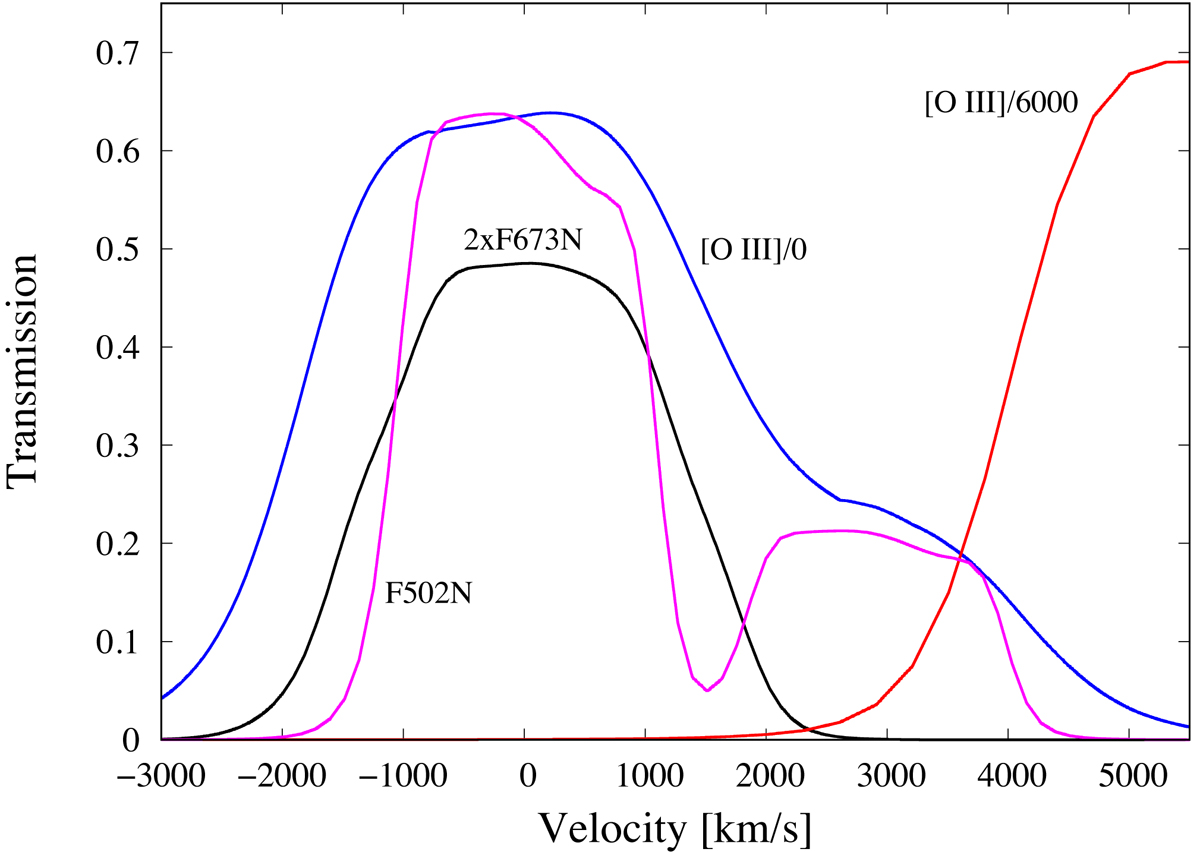
Fig. 3.
Download original image
Effective transmission curves for the ESO/[O III]/0 (blue), ESO[O III]/6000 (red) and HST/F502N (magenta) filters. The velocity is centered on the rest velocity of [O III] λ5007 in the local gas in the LMC, which we assume has a systemic shift of + 273 km s−1 compared to Earth (cf. Morse et al. 2006). The red wings of the curves ESO/[O III]/0 and HST/F502N are due to emission from [O III] λ4959 that enters the filter with a shift of ∼ 2870 km s−1. We have assumed that this line is a factor of three weaker than [O III] λ5007. The black curve shows twice the effective transmission for HST/F673N centered on [S II] λ6731, assuming the intensity of [S II] λ6716 and [S II] λ6731 to be equal.
Current usage metrics show cumulative count of Article Views (full-text article views including HTML views, PDF and ePub downloads, according to the available data) and Abstracts Views on Vision4Press platform.
Data correspond to usage on the plateform after 2015. The current usage metrics is available 48-96 hours after online publication and is updated daily on week days.
Initial download of the metrics may take a while.