Fig. 26.
Download original image
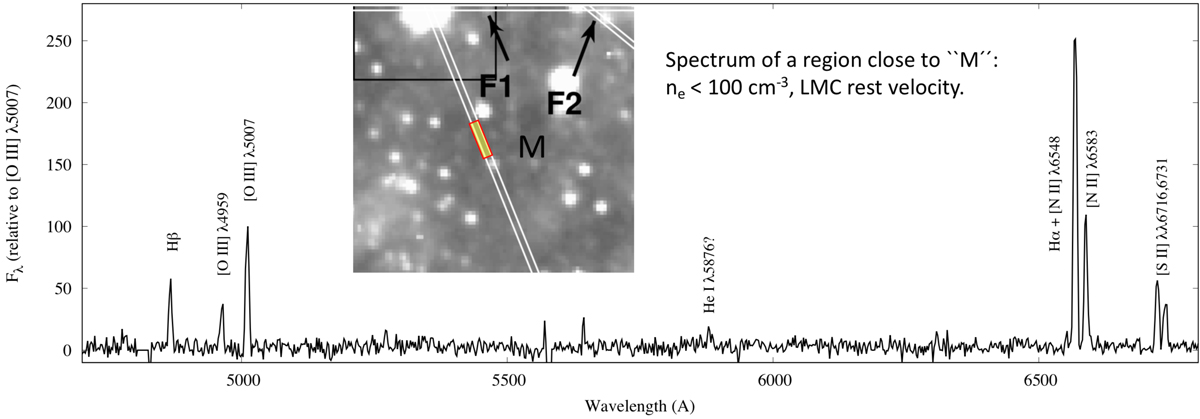
Spectrum of a region (marked in yellow) along the NTT/EMMI slit close to the “N-rich” region identified by Mathewson et al. (1980), here marked with “M”. The map in the inset is from Fig. 2. The spectrum was dereddened with E(B − V) = 0.19, and plotted relative to [O III] λ5007. The electron density is from [S II] λλ6716,6731, and the velocity of the emitting gas is LMC rest velocity. See text for further details.
Current usage metrics show cumulative count of Article Views (full-text article views including HTML views, PDF and ePub downloads, according to the available data) and Abstracts Views on Vision4Press platform.
Data correspond to usage on the plateform after 2015. The current usage metrics is available 48-96 hours after online publication and is updated daily on week days.
Initial download of the metrics may take a while.