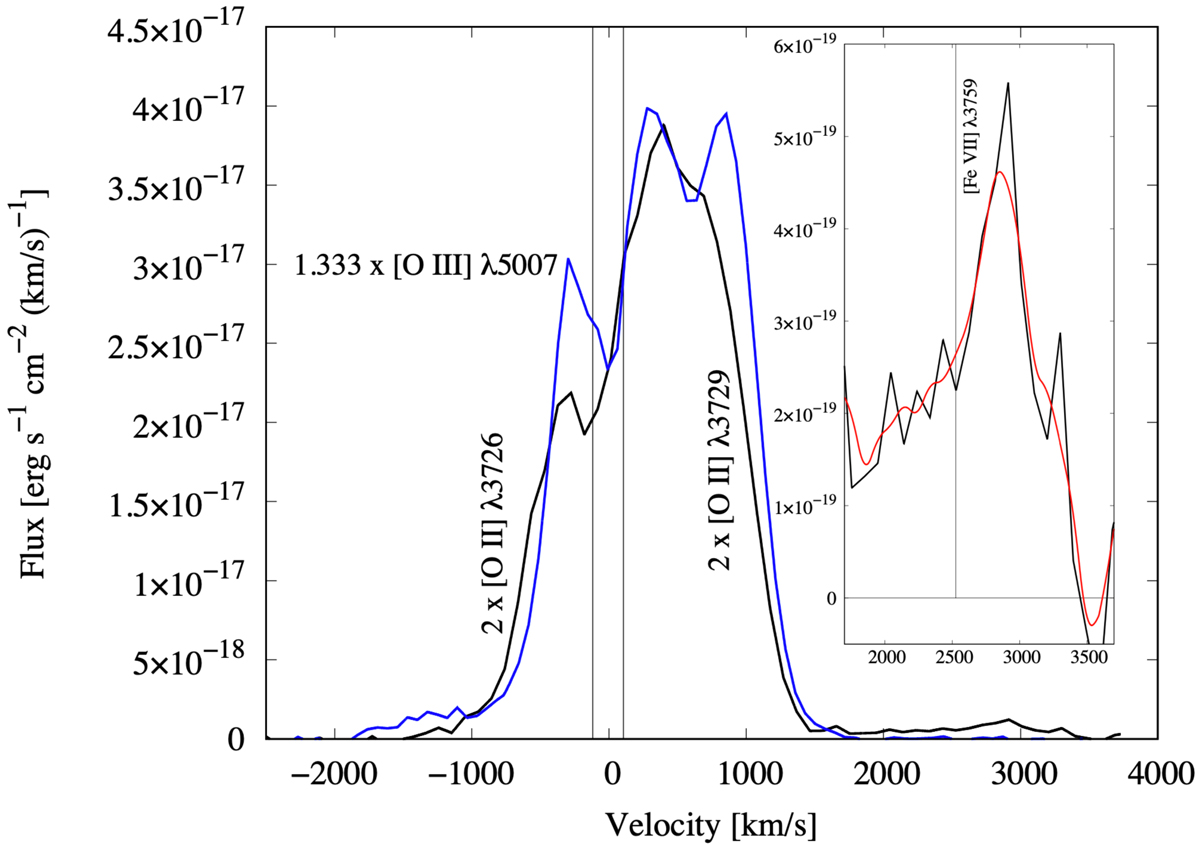
Fig. 20.
Download original image
Same profile for [O III]λλ4959,5007 as in Fig. 16 (blue), together with the combined [O II] λλ3726,3729 profile. The velocity for the [O II] lines is centered on 3727.5 Å. The [O II] profile was multiplied by a factor of 2 to match 1.33× [O III] λ5007. We note that [O II] λ3726 only reaches ≈ − 1400 km s−1 on the blue side (when the 118 km s−1 difference between [O II] λ3726 and 3727.5 Å is accounted for). On the red side of [O II] λ3729 the emission is blended with [Fe VII] λ3759, as shown by the inset. The red curve is Savitzky-Golay fitting to the noisy [Fe VII] line profile.
Current usage metrics show cumulative count of Article Views (full-text article views including HTML views, PDF and ePub downloads, according to the available data) and Abstracts Views on Vision4Press platform.
Data correspond to usage on the plateform after 2015. The current usage metrics is available 48-96 hours after online publication and is updated daily on week days.
Initial download of the metrics may take a while.