Fig. 2.
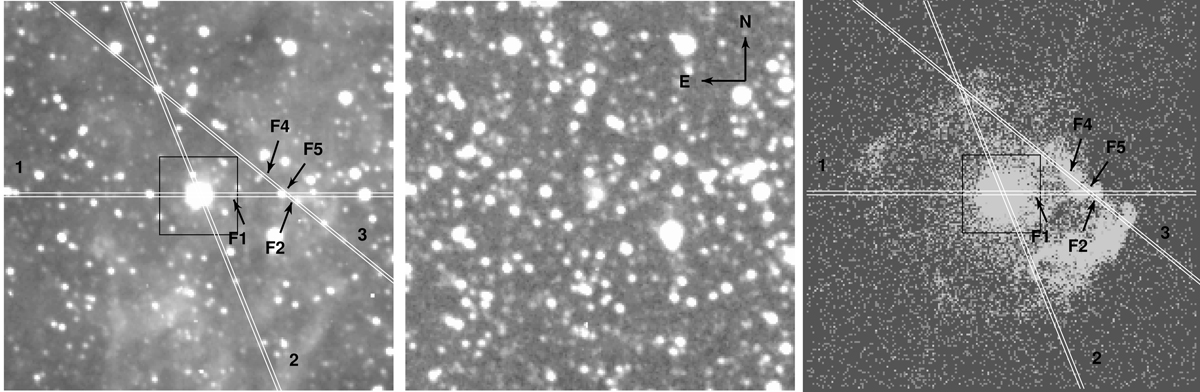
Download original image
100″ × 100″ region of the field around 0540 marked with a box in Fig. 1. The images are obtained in the [O III]/0 (left) and [O III]/6000 (middle) bands with NTT/EMMI, and in the 1.5–6.4 keV X-ray range (right) with Chandra/ACIS (Hwang et al. 2001). The positions of all the slits used in the spectral observations, and of the detected H II regions are marked as in Fig. 1. The agreement between the optical and X-ray coordinates is subarcsecond since the pulsar was used as a reference (see Lundqvist et al. 2011). A 20″ × 20″ box marks the inner region of 0540 blown up in Fig. 4. We note that the H II structures named as “F1”, “F2”, “F4” and “F5” are projected on regions with strong X-ray emission from the SNR.
Current usage metrics show cumulative count of Article Views (full-text article views including HTML views, PDF and ePub downloads, according to the available data) and Abstracts Views on Vision4Press platform.
Data correspond to usage on the plateform after 2015. The current usage metrics is available 48-96 hours after online publication and is updated daily on week days.
Initial download of the metrics may take a while.