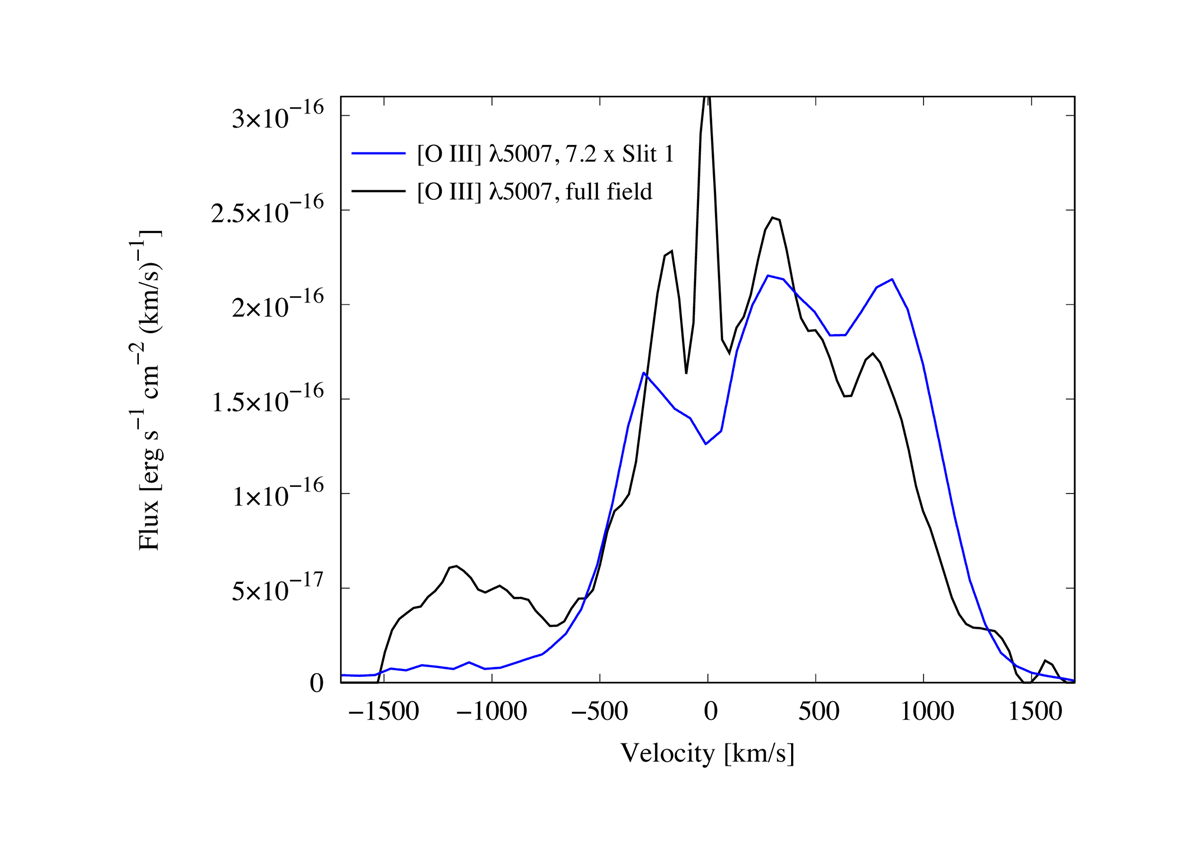
Fig. 19.
Download original image
Same profile for [O III]λλ4959,5007 as in Fig. 16 (blue), together with the [O III]λλ4959,5007 profile for the full 13″ × 13″ field as observed by Sandin et al. (2013). The slit 1 profile was multiplied by a factor of 7.2 to match the integrated emission at ≥ − 750 km s−1. We note strong [O III] emission for ≤ − 750 km s−1 for the larger field-of-view compared to the slit 1 observations. This emission corresponds to about 10% of the total [O III] emission. A minor fraction (∼10%) of the emission at ≤ − 750 km s−1 could be due to [Fe III] λ4986, as displayed in Fig. 17, but most of it comes from the approaching “wall” described in Sect. 3.2.
Current usage metrics show cumulative count of Article Views (full-text article views including HTML views, PDF and ePub downloads, according to the available data) and Abstracts Views on Vision4Press platform.
Data correspond to usage on the plateform after 2015. The current usage metrics is available 48-96 hours after online publication and is updated daily on week days.
Initial download of the metrics may take a while.