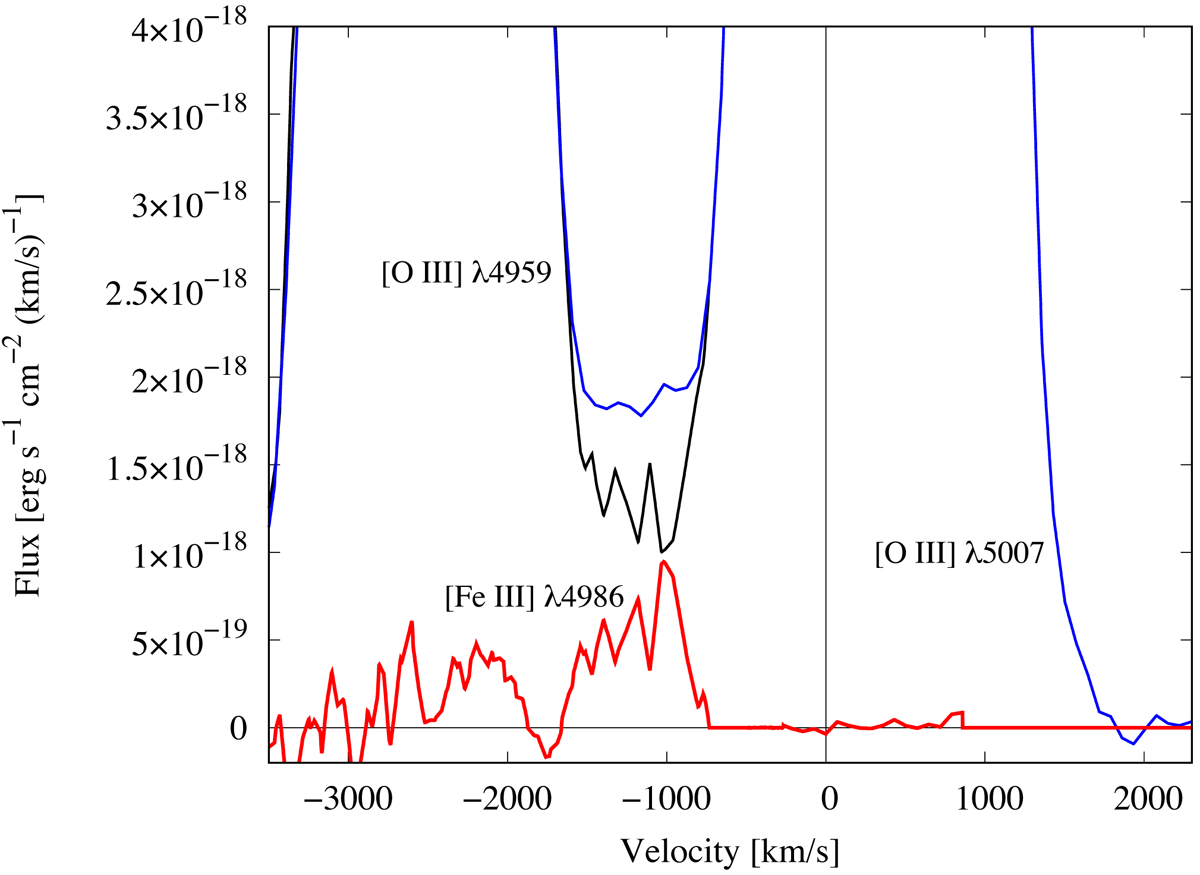
Fig. 17.
Download original image
Sum of the “cleaned” [O III]λλ4959,5007 profiles (cf. Fig. 16) of the emission from 0540 (black) compared to the observed emission (blue). The velocity scale is for the λ5007 component relative to LMC. The difference (red) is attributed to [Fe III] λ4986. The maximum velocity on the red side of [O III] λ5007 is ≈ + 1800 km s−1, which may be less than on the blue side (≈ − 1900 km s−1, see Fig. 16).
Current usage metrics show cumulative count of Article Views (full-text article views including HTML views, PDF and ePub downloads, according to the available data) and Abstracts Views on Vision4Press platform.
Data correspond to usage on the plateform after 2015. The current usage metrics is available 48-96 hours after online publication and is updated daily on week days.
Initial download of the metrics may take a while.