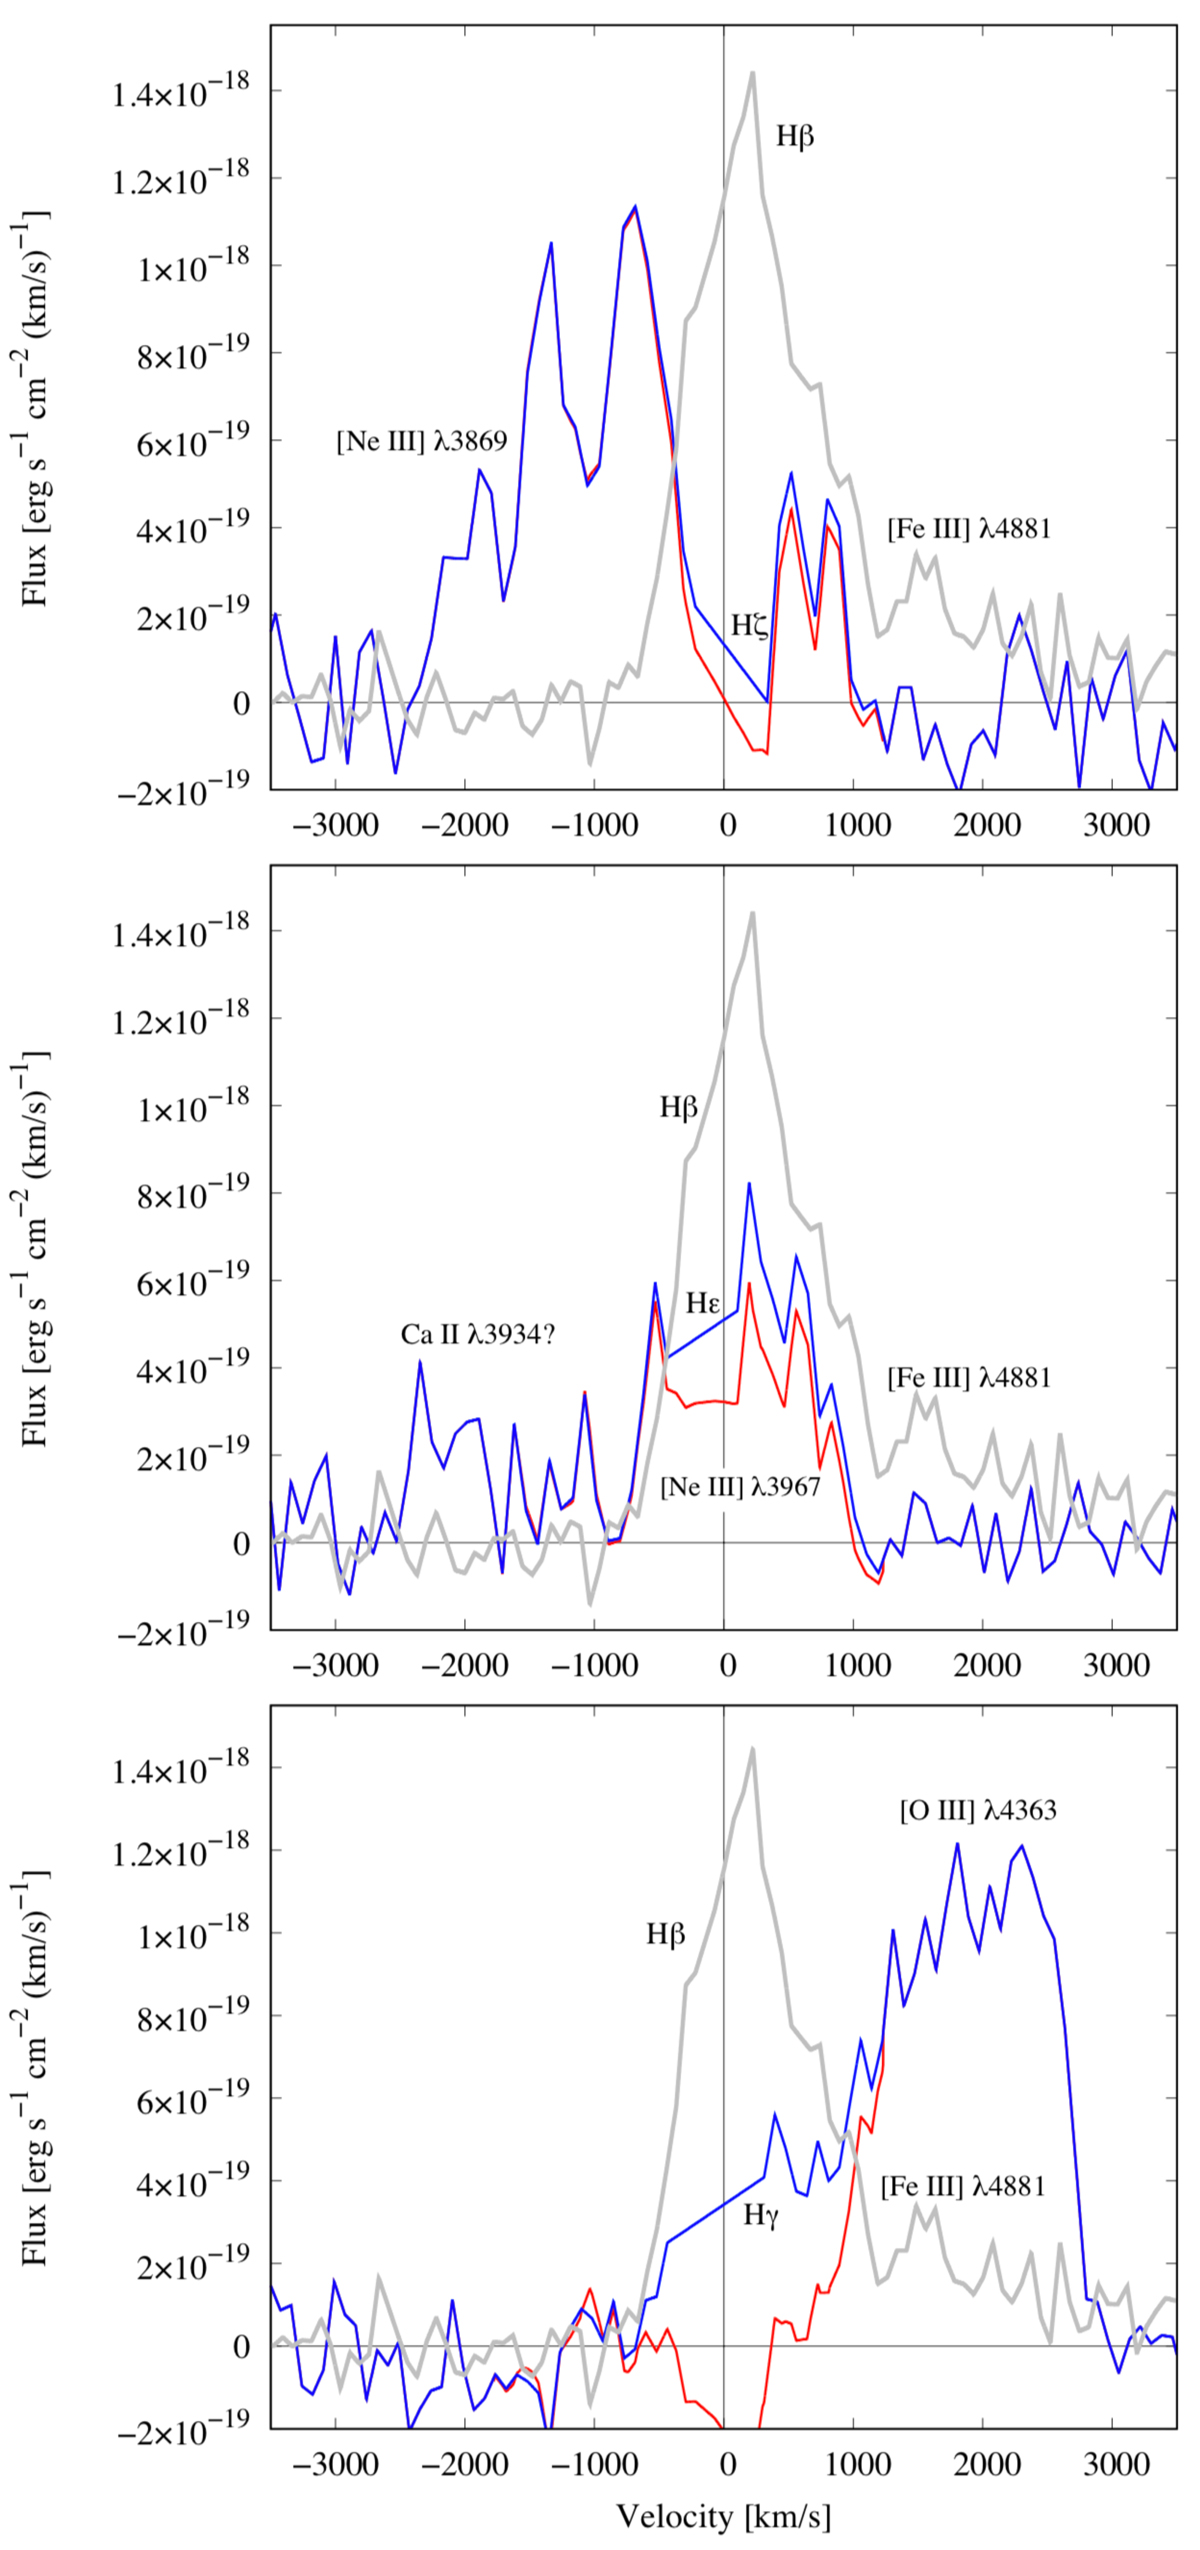
Fig. 15.
Download original image
Line profiles of the Balmer lines from 0540 in velocity space relative to LMC for the VLT spectrum in Fig. 12. Top panel: Hζ blended with [Ne III] λ3869, middle panel: Hϵ blended with [Ne III] λ3967, and bottom panel: Hγ blended with [O III] λ4363. In all panels we also show Hβ (gray) and the continuum level (black). Hβ was used as a template to subtract the expected emission from Hγ, Hϵ and Hζ using Case B line ratios (Brocklehurst 1971). The blue and red solid lines show [O III] λ4363 and [Ne III] λλ3869,3967 before and after deblending, respectively.
Current usage metrics show cumulative count of Article Views (full-text article views including HTML views, PDF and ePub downloads, according to the available data) and Abstracts Views on Vision4Press platform.
Data correspond to usage on the plateform after 2015. The current usage metrics is available 48-96 hours after online publication and is updated daily on week days.
Initial download of the metrics may take a while.