Free Access
Fig. 14.
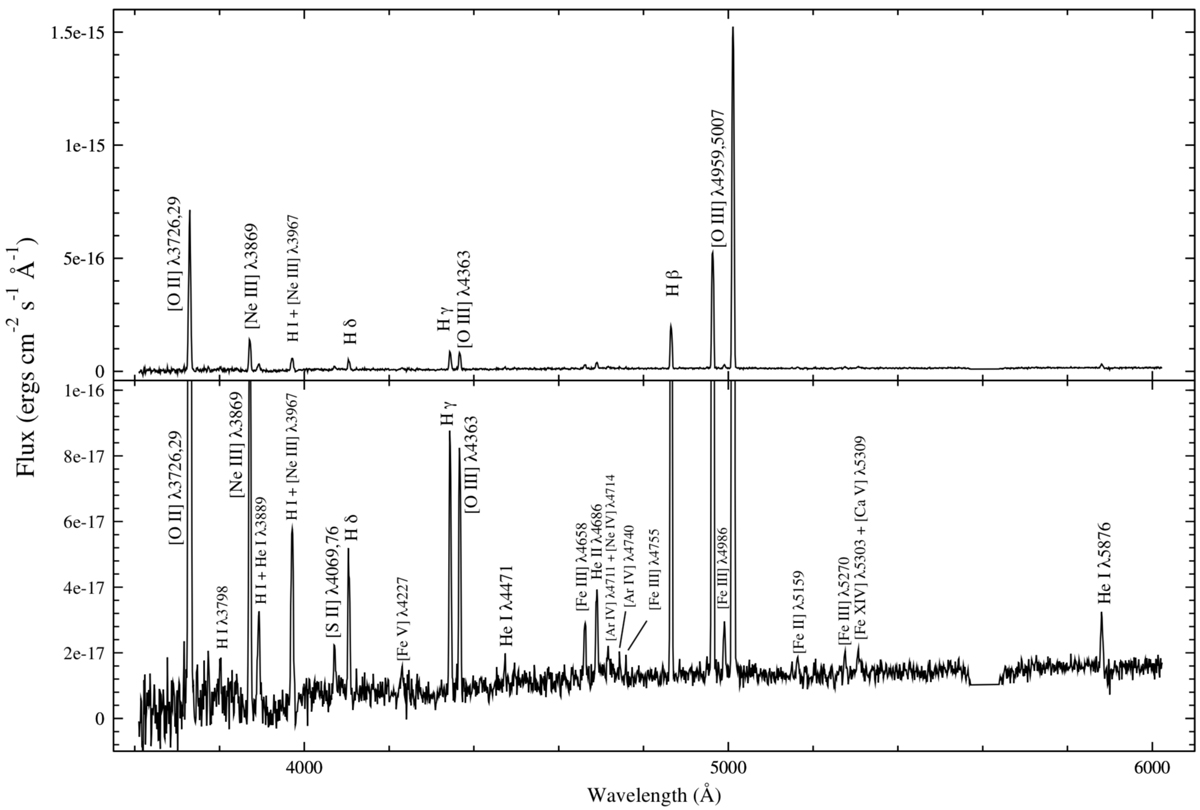
Download original image
Spectrum of an H II region along the VLT slit “3” at a projected distance of 25″ to the west of the pulsar (called filament F5 in Figs. 1 and 2). As in Fig. 11, we have also plotted spectra with expanded flux scales to highlight weaker lines. The spectrum have been dereddened using E(B − V) = 0.19 and RV = 3.1.
Current usage metrics show cumulative count of Article Views (full-text article views including HTML views, PDF and ePub downloads, according to the available data) and Abstracts Views on Vision4Press platform.
Data correspond to usage on the plateform after 2015. The current usage metrics is available 48-96 hours after online publication and is updated daily on week days.
Initial download of the metrics may take a while.