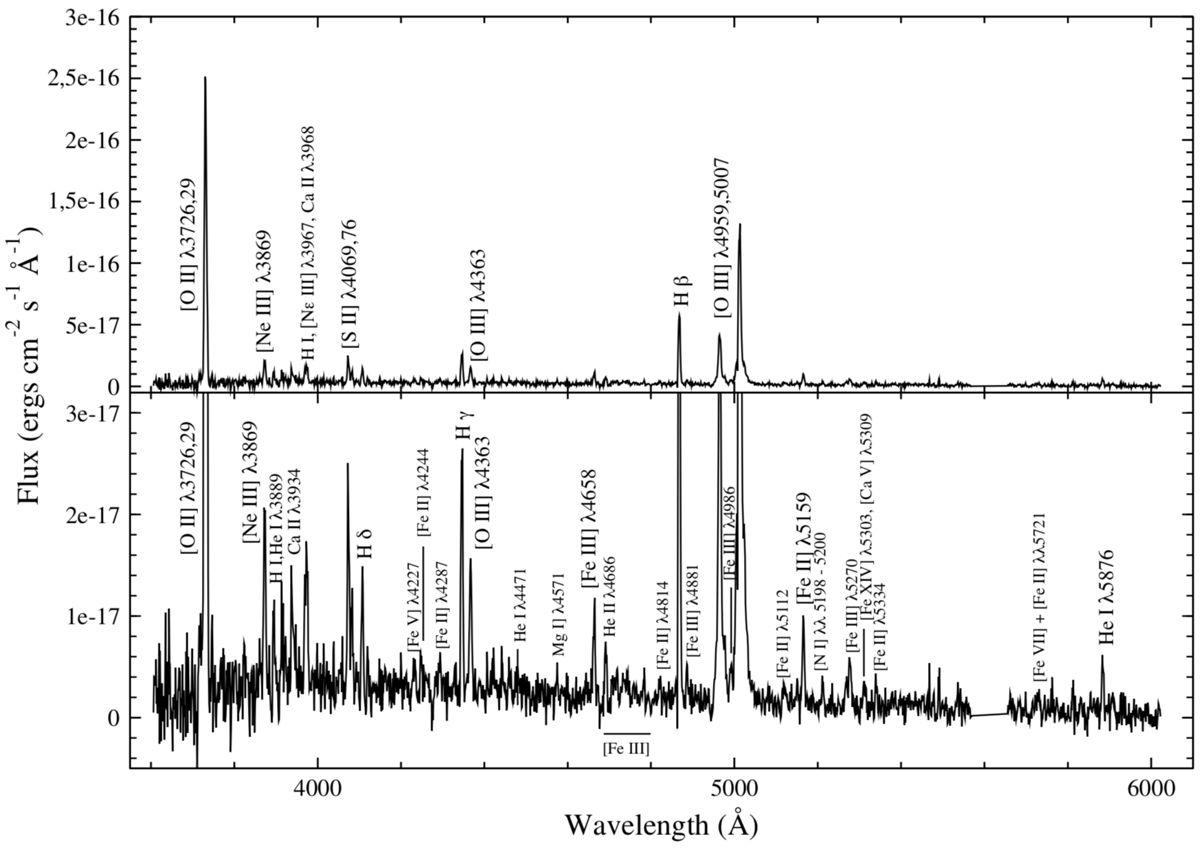
Fig. 13.
Download original image
Spectrum of filament F1 in the vicinity of SNR 0540-69.3. The filament is situated only 8″ west of the pulsar (see Figs. 1 and 2). As in Figs. 11 and 12, we have also plotted the spectra with expanded flux scales to highlight weaker lines. The spectrum was dereddened using E(B − V) = 0.19 and RV = 3.1. We note that the broad base of the [O III] λλ4959,5007 lines is skewed to the red as compared to the narrow components, reaching at least +1700 km s−1. No such features are seen in spectra of the emission from filaments F2, F3, F4, or F5 (see Fig. 14), as marked in Fig. 1. Line fluxes of all filaments are given in Tables 3 and 4.
Current usage metrics show cumulative count of Article Views (full-text article views including HTML views, PDF and ePub downloads, according to the available data) and Abstracts Views on Vision4Press platform.
Data correspond to usage on the plateform after 2015. The current usage metrics is available 48-96 hours after online publication and is updated daily on week days.
Initial download of the metrics may take a while.