Fig. 12.
Download original image
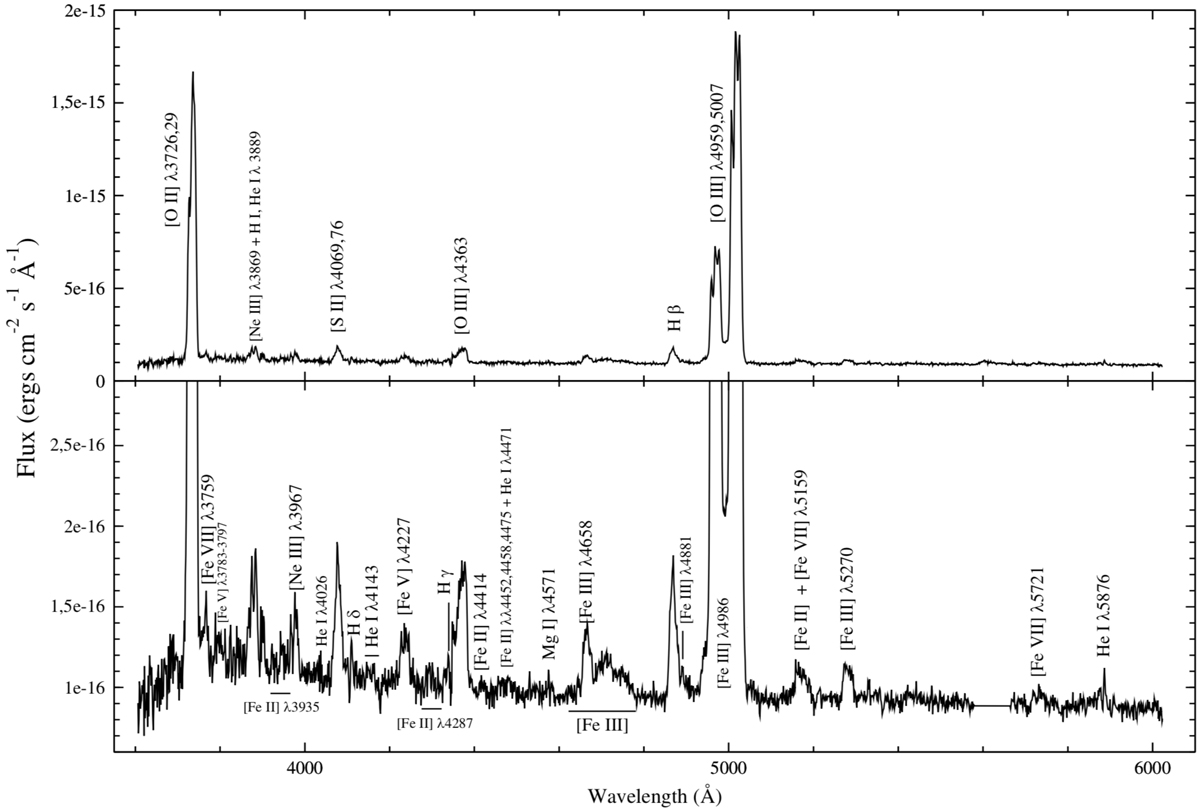
Spectrum obtained with ESO/VLT (PA = 88°), and again (as in the Fig. 11) the lower panel is plotted to bring out weaker lines. The spectrum has been dereddened using E(B − V) = 0.19 and RV = 3.1. We note the significantly higher signal-to-noise in the VLT spectrum compared to Fig. 11, which made it possible to detect new lines in SNR 0540-69.3 as reported in Serafimovich et al. (2005) and here. Of particular importance are the [Ne III] lines and Hβ (see text).
Current usage metrics show cumulative count of Article Views (full-text article views including HTML views, PDF and ePub downloads, according to the available data) and Abstracts Views on Vision4Press platform.
Data correspond to usage on the plateform after 2015. The current usage metrics is available 48-96 hours after online publication and is updated daily on week days.
Initial download of the metrics may take a while.