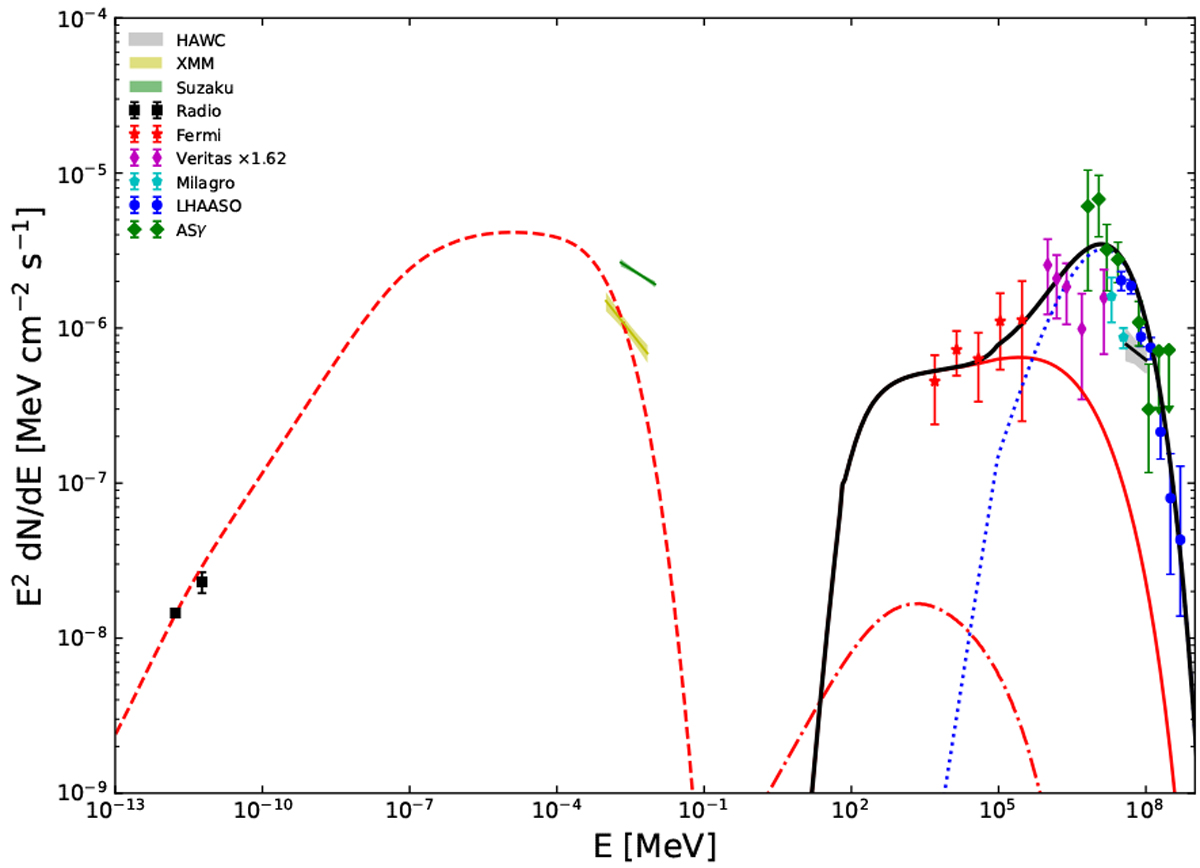
Fig. 4
Download original image
Multiwave band spectra of G106.3+2.7. The red line shows synchrotron (dashed line), inverse Compton (dot-dashed line), and pp interaction (solid line) inside the SNR. The dotted blue line represents the high-energy emission from the escapedprotons interacting with the MC, and the black line shows the overall VHE emission (pp interaction). Radio data of the tail region are from Pineault & Joncas (2000). The statistical uncertainties of the tail region of XMM-Newton are from Ge et al. (2021), and of the whole region of Suzaku, they are from Fujita et al. (2021). The Fermi-LAT data are from Xin et al. (2019), the VERITAS data are from Acciari et al. (2009), the Milagro data are from Abdo et al. (2007, 2009), the statistical uncertainties of HAWC are from Albert et al. (2020), the ASγ data are from Tibet ASg Collaboration (2021), and the LHAASO data are from Cao et al. (2021).
Current usage metrics show cumulative count of Article Views (full-text article views including HTML views, PDF and ePub downloads, according to the available data) and Abstracts Views on Vision4Press platform.
Data correspond to usage on the plateform after 2015. The current usage metrics is available 48-96 hours after online publication and is updated daily on week days.
Initial download of the metrics may take a while.