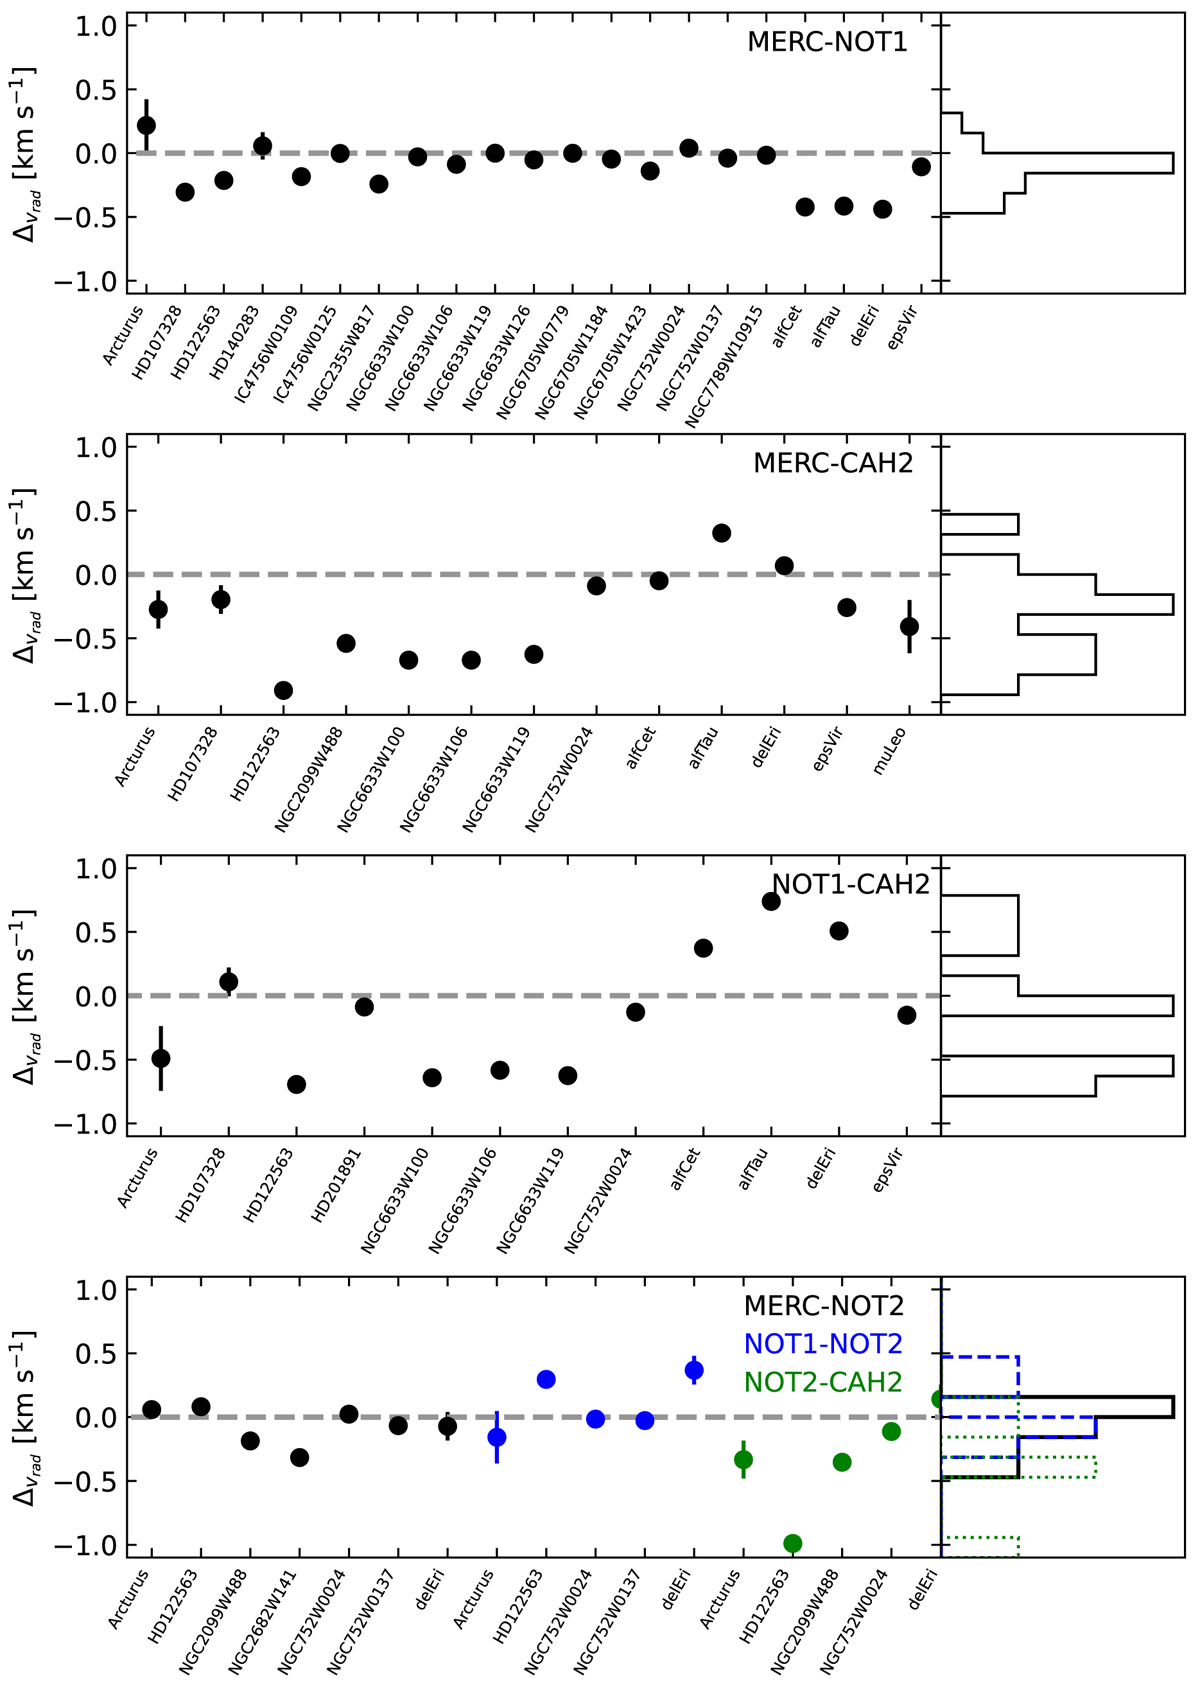
Fig. 4.
Download original image
Differences in vrad obtained for stars in common between MERC and NOT1 (top panel), MERC and CAH2 (top central panel), NOT1 and CAH2 (bottom central panel), NOT2 and MERC (blue), and CAH2 (red), respectively (bottom panel). The error bars are the sum of the square of the uncertainties. In most of the cases, error bars are smaller than symbol sizes.
Current usage metrics show cumulative count of Article Views (full-text article views including HTML views, PDF and ePub downloads, according to the available data) and Abstracts Views on Vision4Press platform.
Data correspond to usage on the plateform after 2015. The current usage metrics is available 48-96 hours after online publication and is updated daily on week days.
Initial download of the metrics may take a while.