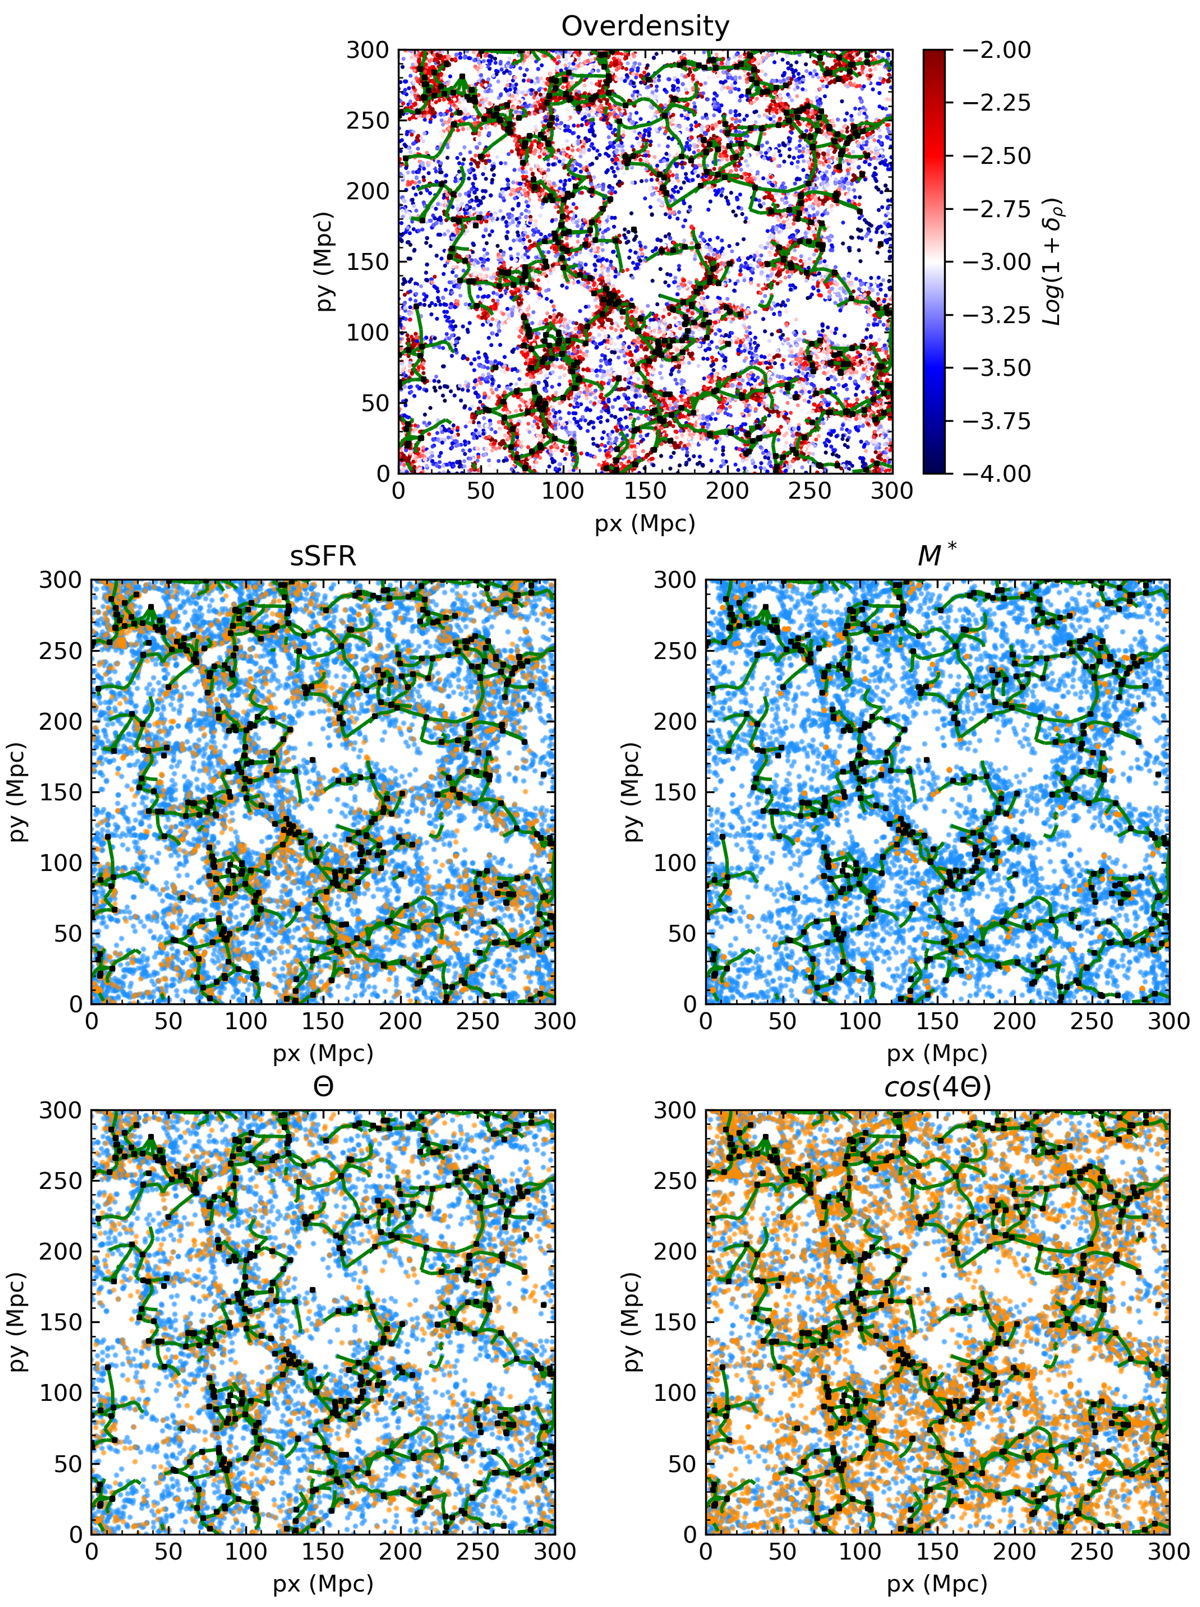
Fig. 5.
Download original image
Galaxy positions with respect to the cosmic web features. This figure shows a slice 25 Mpc thick of the simulation box that encompasses the most massive subhalo of the simulation. In all panels, points represent galaxies, green lines show filaments, and black squares are maxima and bifurcations as derived by DisPerSE. Top panel: subhaloes are colour-coded according to their local density (log(1 + δρ)); all subhaloes are shown. In the bottom four panels, subhaloes are colour-coded according to which population they belong: star-forming (light blue) or quenched (orange) in the middle left, low-mass (light blue) or high-mass (orange) in the middle right, perpendicular (light blue) or parallel (orange) in the bottom left, no orientation (light blue) or ordered (orange) in the bottom right. See Sect. 3.2 for the distinction in the various subsets. Top left and bottom right panels: all subhaloes are shown, while in the other panels, subhaloes that do not belong to the considered populations are not shown.
Current usage metrics show cumulative count of Article Views (full-text article views including HTML views, PDF and ePub downloads, according to the available data) and Abstracts Views on Vision4Press platform.
Data correspond to usage on the plateform after 2015. The current usage metrics is available 48-96 hours after online publication and is updated daily on week days.
Initial download of the metrics may take a while.