Fig. B.1.
Download original image
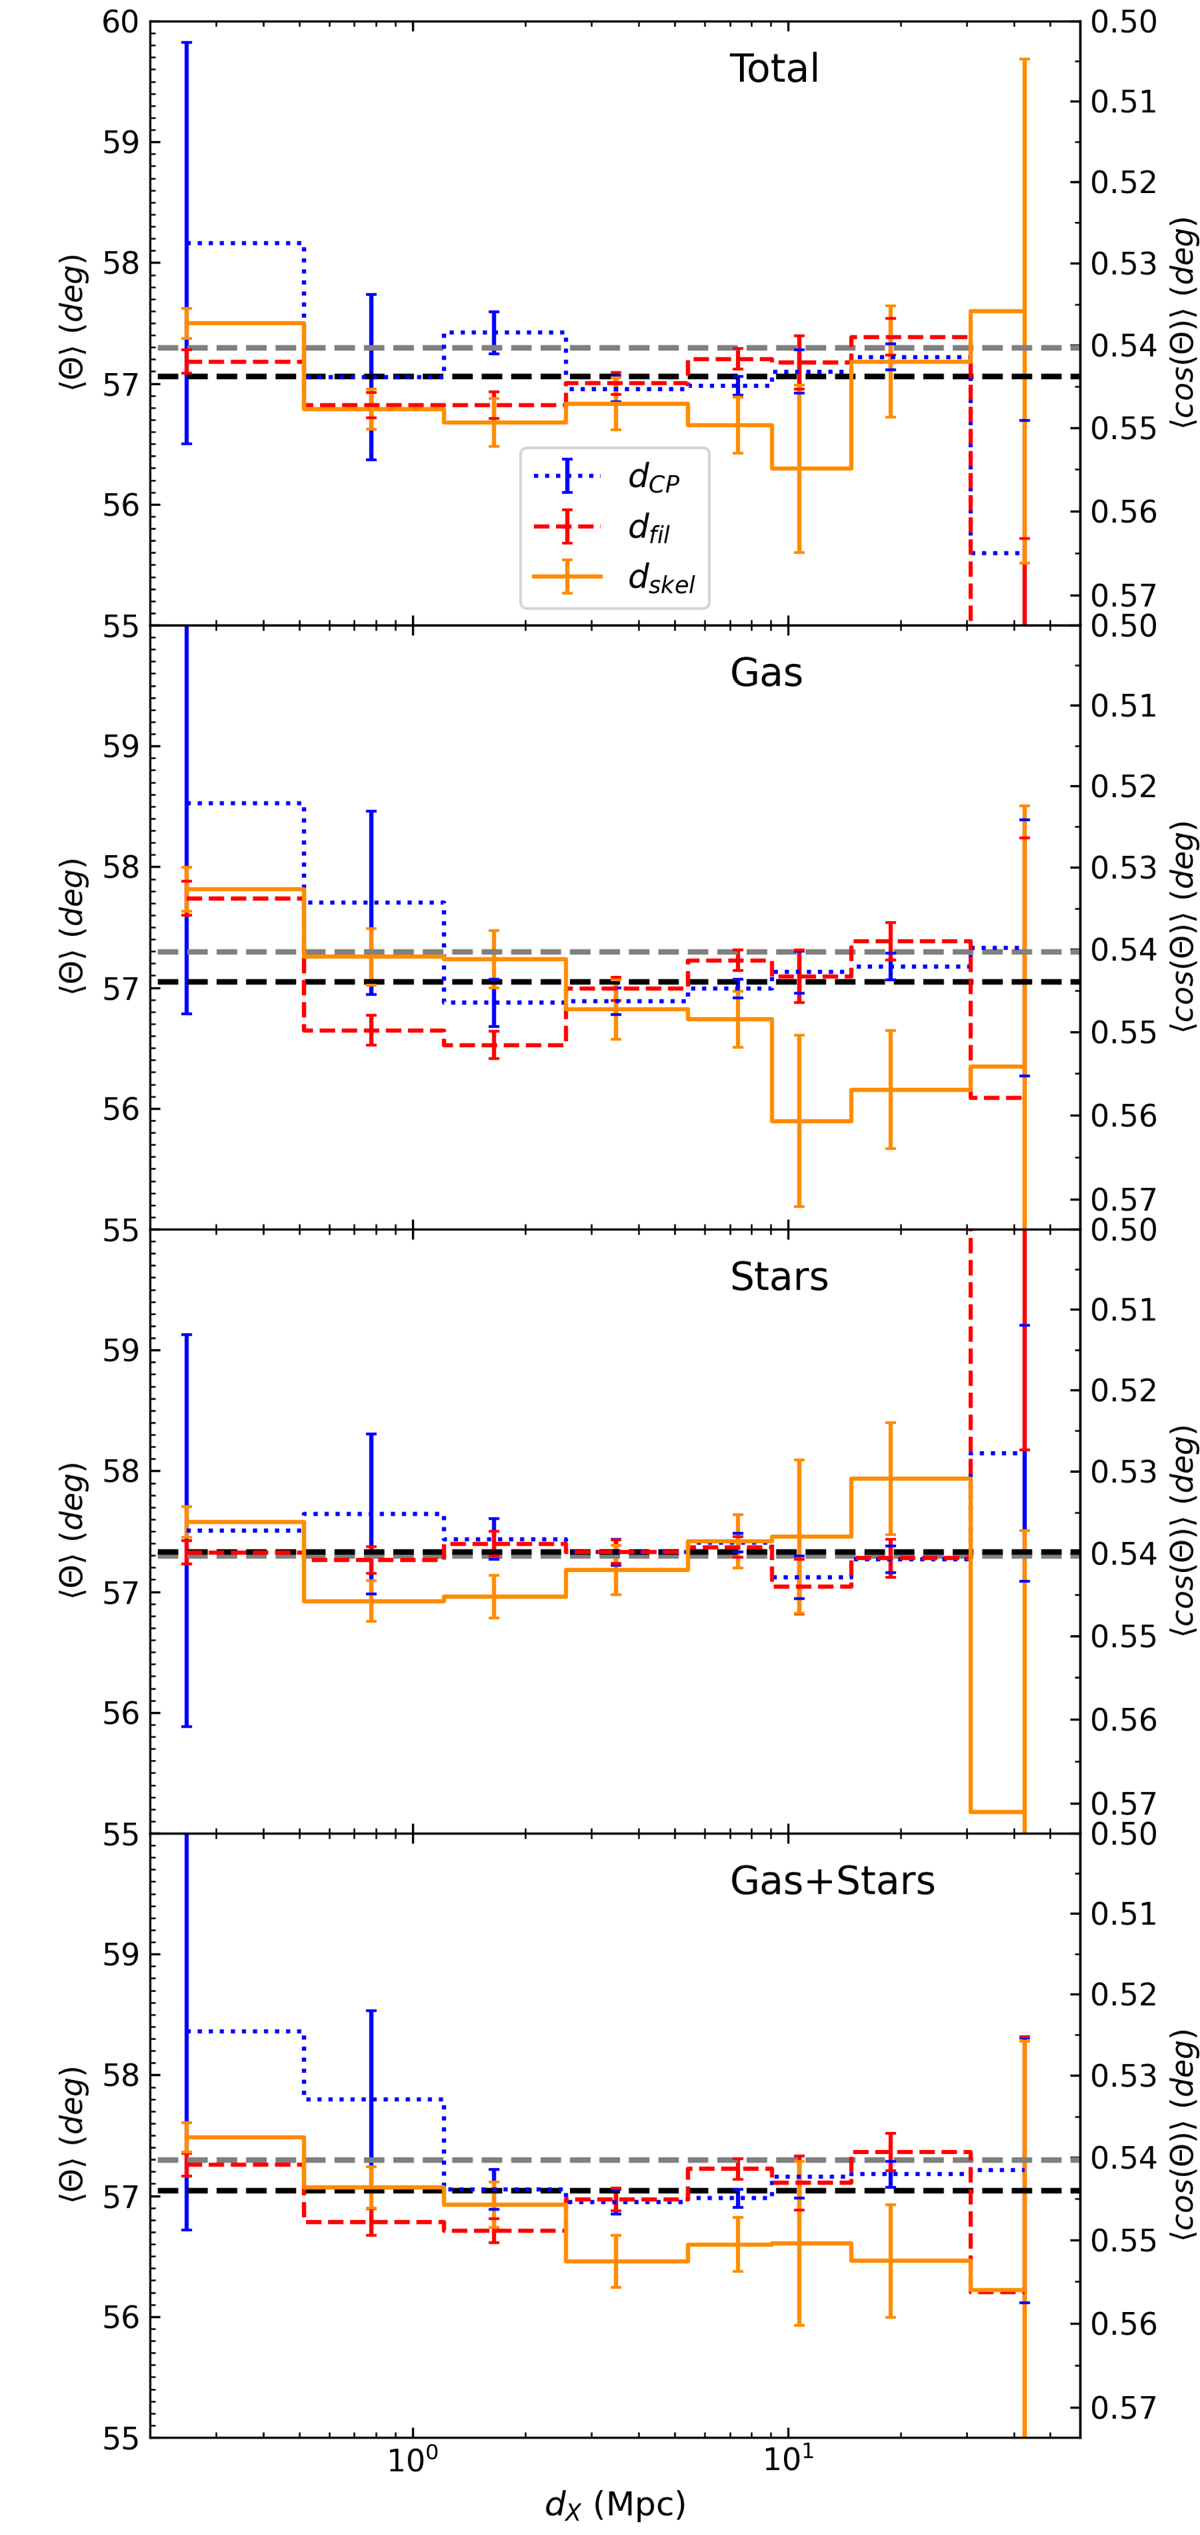
Distributions of ⟨θ⟩ as a function of the distances from the features of the cosmic web dfil (dashed red line in every panel), dCP (dotted blue line in every panel), and dskel (solid orange line in every panel). The first panel shows the distributions obtained when all subhalo components are considered (same as the top middle panel of Figure 6), the subsequent panels refer to the distributions obtained when only the gas component is considered (second panel), only the stellar component (third panel), and when both gas and stars (but not dark matter) are considered (bottom panel). The dashed black line in every panel is the average of the considered quantity in the full simulation box. In the top middle panel, the grey line is ![]() , computed given equation (3) for the total subhalo sample. In every panel, the first distance bin considered extends all the way to zero for all distances, but it is cut because the x-axis is in logarithmic scale.
, computed given equation (3) for the total subhalo sample. In every panel, the first distance bin considered extends all the way to zero for all distances, but it is cut because the x-axis is in logarithmic scale.
Current usage metrics show cumulative count of Article Views (full-text article views including HTML views, PDF and ePub downloads, according to the available data) and Abstracts Views on Vision4Press platform.
Data correspond to usage on the plateform after 2015. The current usage metrics is available 48-96 hours after online publication and is updated daily on week days.
Initial download of the metrics may take a while.