Open Access
Fig. 6
Download original image
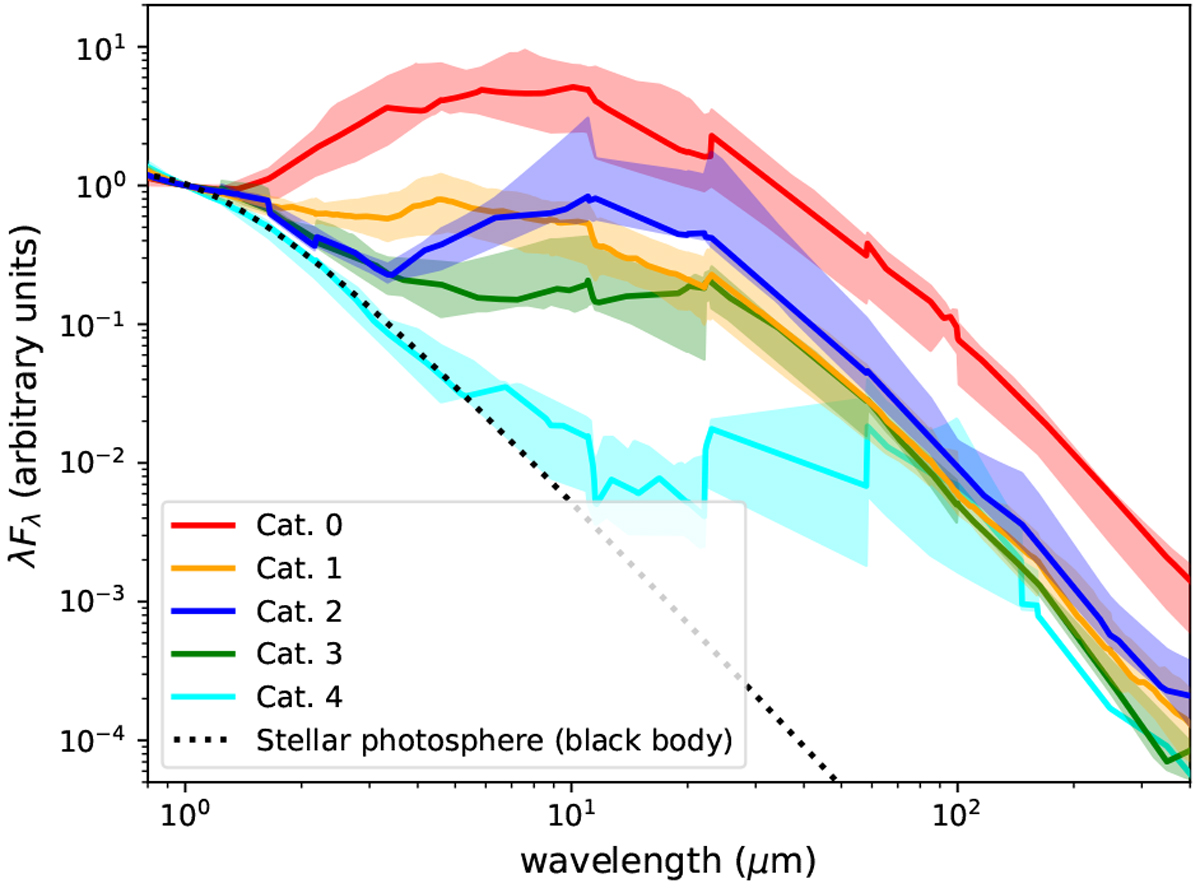
Median infrared excess in SEDs. Solid lines represent the median SED for each category normalized at 1 μm. The SEDs are enveloped by an area representing the 25th-to-75th percentiles SED of each category. A black body of T = 5500 K is plotted for illustration to mimic a stellar photosphere.
Current usage metrics show cumulative count of Article Views (full-text article views including HTML views, PDF and ePub downloads, according to the available data) and Abstracts Views on Vision4Press platform.
Data correspond to usage on the plateform after 2015. The current usage metrics is available 48-96 hours after online publication and is updated daily on week days.
Initial download of the metrics may take a while.