Fig. 4
Download original image
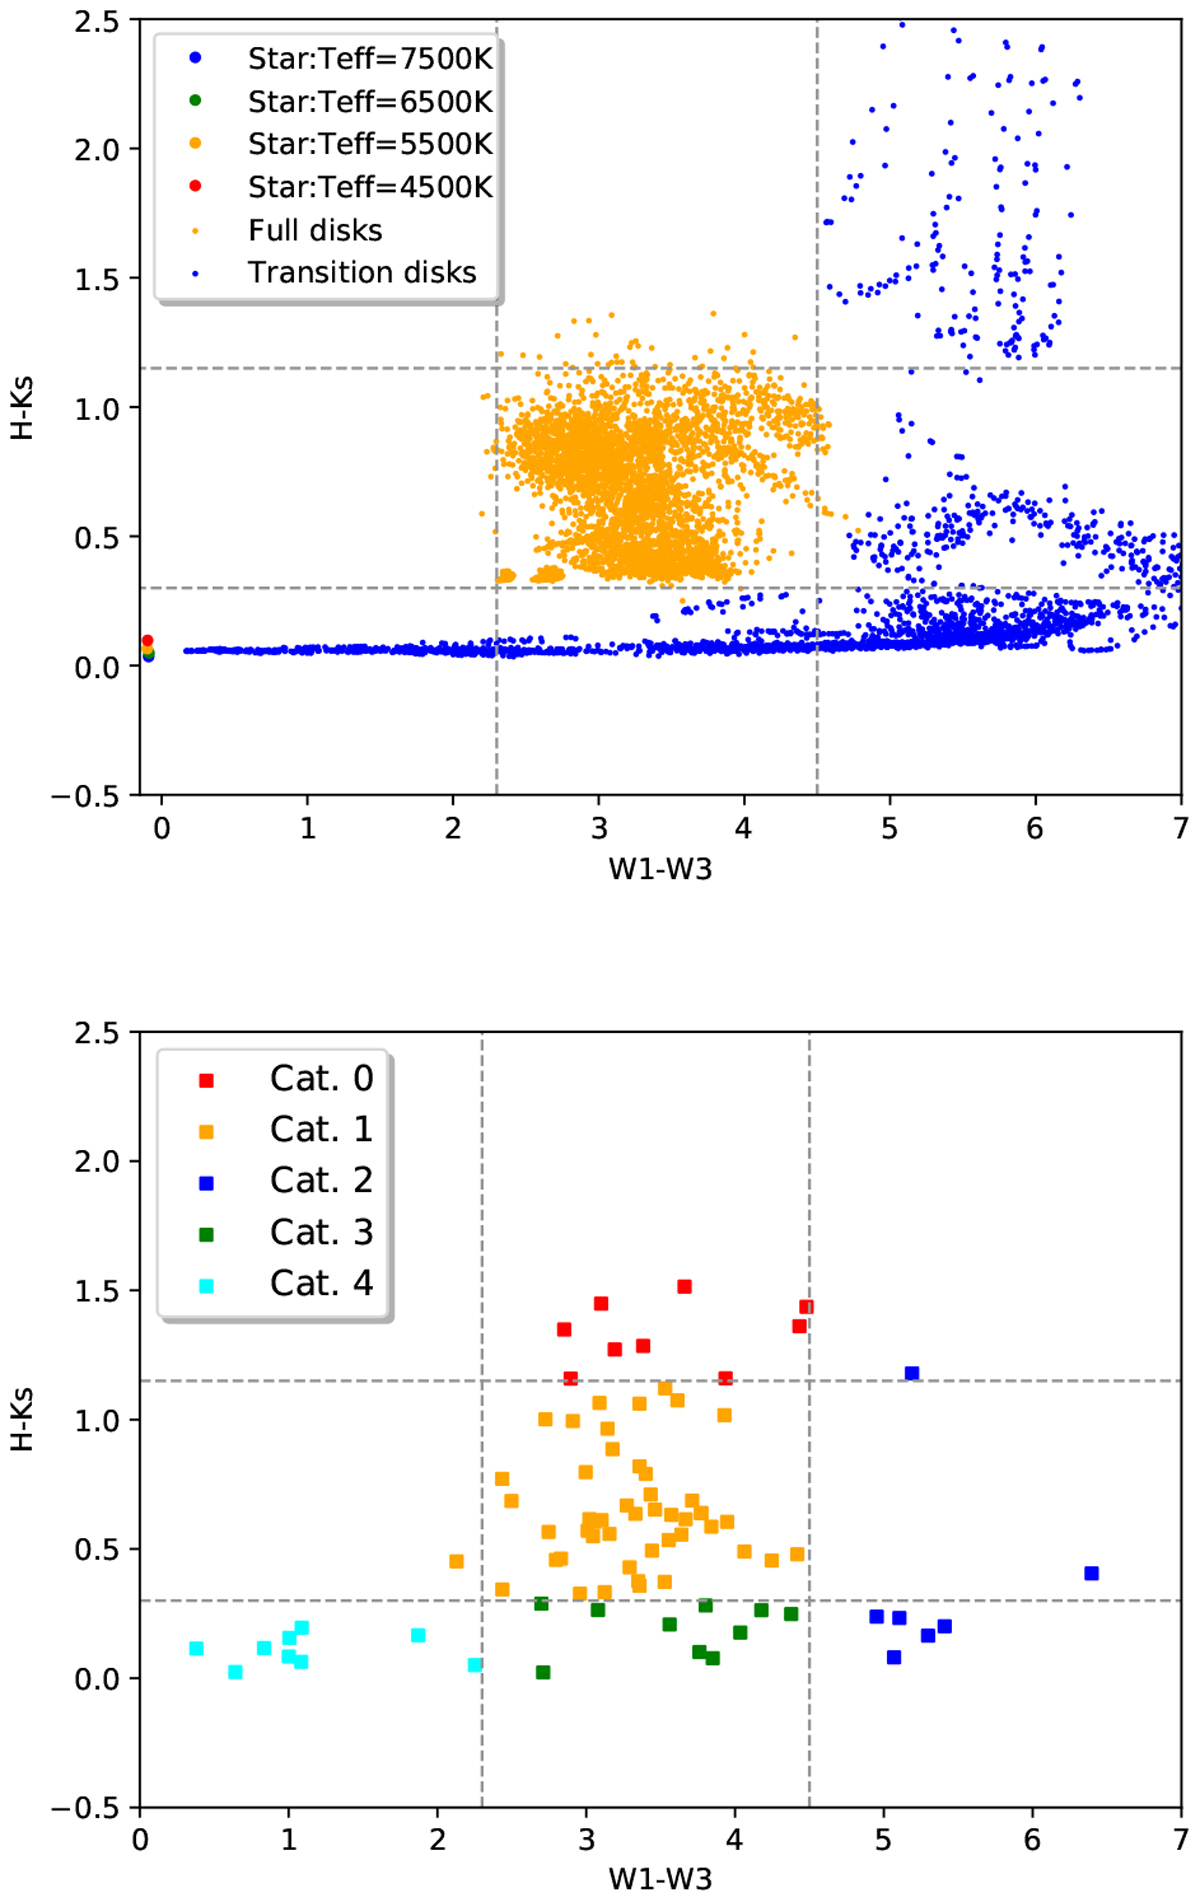
Color-color diagrams for models and targets. Top: positions of the models of IRAS 08544-4431-like (orange) and AC Her-like (blue) disks in the color-color diagram. The dashed gray lines represent the boundaries between the different categories defined in the text. Bottom: locations of the observed disks color-coded with their assigned categories.
Current usage metrics show cumulative count of Article Views (full-text article views including HTML views, PDF and ePub downloads, according to the available data) and Abstracts Views on Vision4Press platform.
Data correspond to usage on the plateform after 2015. The current usage metrics is available 48-96 hours after online publication and is updated daily on week days.
Initial download of the metrics may take a while.