Free Access
Fig. 17
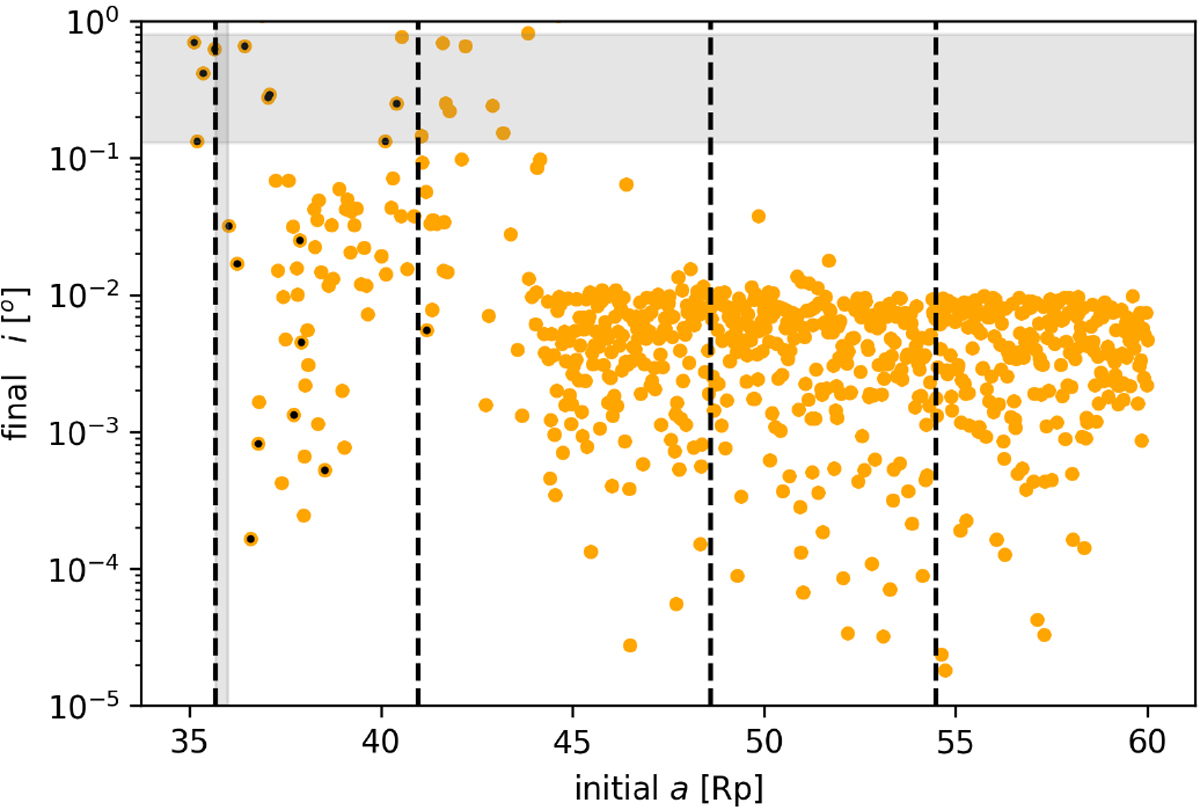
Download original image
Distribution of inclination for the disc of particles after the dual synchronisation of the PC system with mass growth. Theorbits that do not survive the entire integration time are identified with black dots. The shaded grey region indicates the range of values according to diverse authors (see Table 1).
Current usage metrics show cumulative count of Article Views (full-text article views including HTML views, PDF and ePub downloads, according to the available data) and Abstracts Views on Vision4Press platform.
Data correspond to usage on the plateform after 2015. The current usage metrics is available 48-96 hours after online publication and is updated daily on week days.
Initial download of the metrics may take a while.