Fig. 6
Download original image
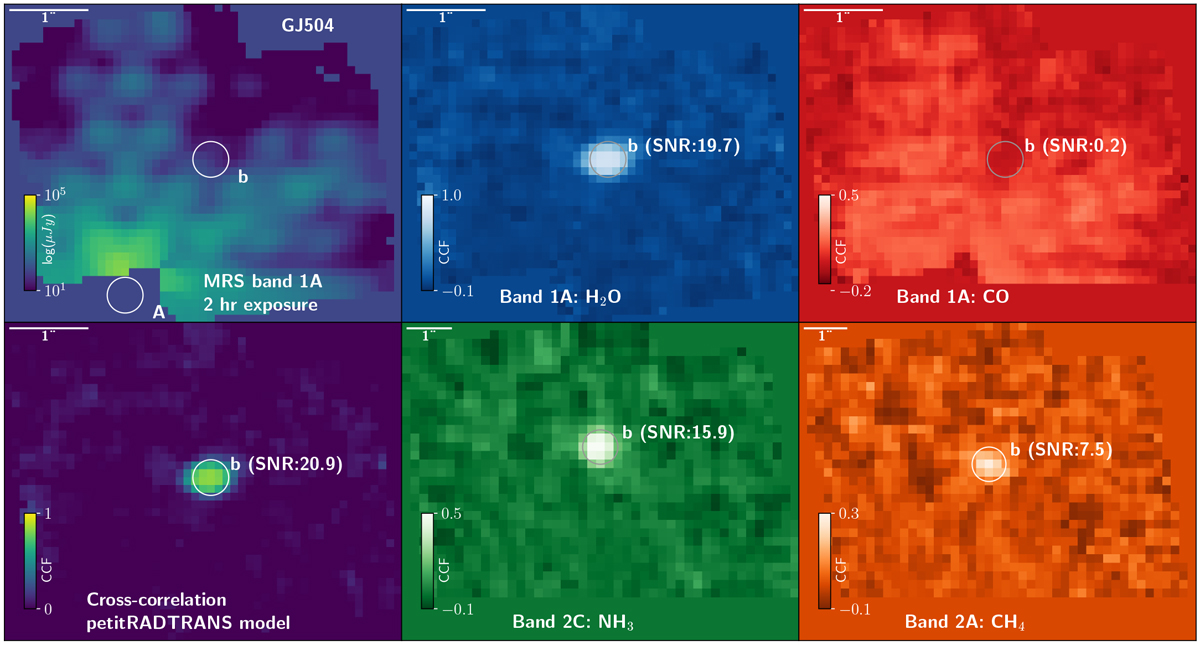
Result of molecular mapping for a simulated observation of GJ504 b with the MRS for single sub-bands. First vertical column: single log-scaled frame from the flux calibrated and reconstructed cube, and the same frame cross-correlated with its input spectrum for sub-band 1A. Second and third vertical columns: cross correlation maps of filtered cubes with individual molecular templates correctly identify the abundant species of H2 O CH4 and NH3. No CO is detected (top right panel), as expected from chemical equilibrium models for cold objects as for instance GJ 504 b. Values in parentheses indicate the S/N and the sub-bands with the highest S/N are plotted.
Current usage metrics show cumulative count of Article Views (full-text article views including HTML views, PDF and ePub downloads, according to the available data) and Abstracts Views on Vision4Press platform.
Data correspond to usage on the plateform after 2015. The current usage metrics is available 48-96 hours after online publication and is updated daily on week days.
Initial download of the metrics may take a while.