Fig. 3
Download original image
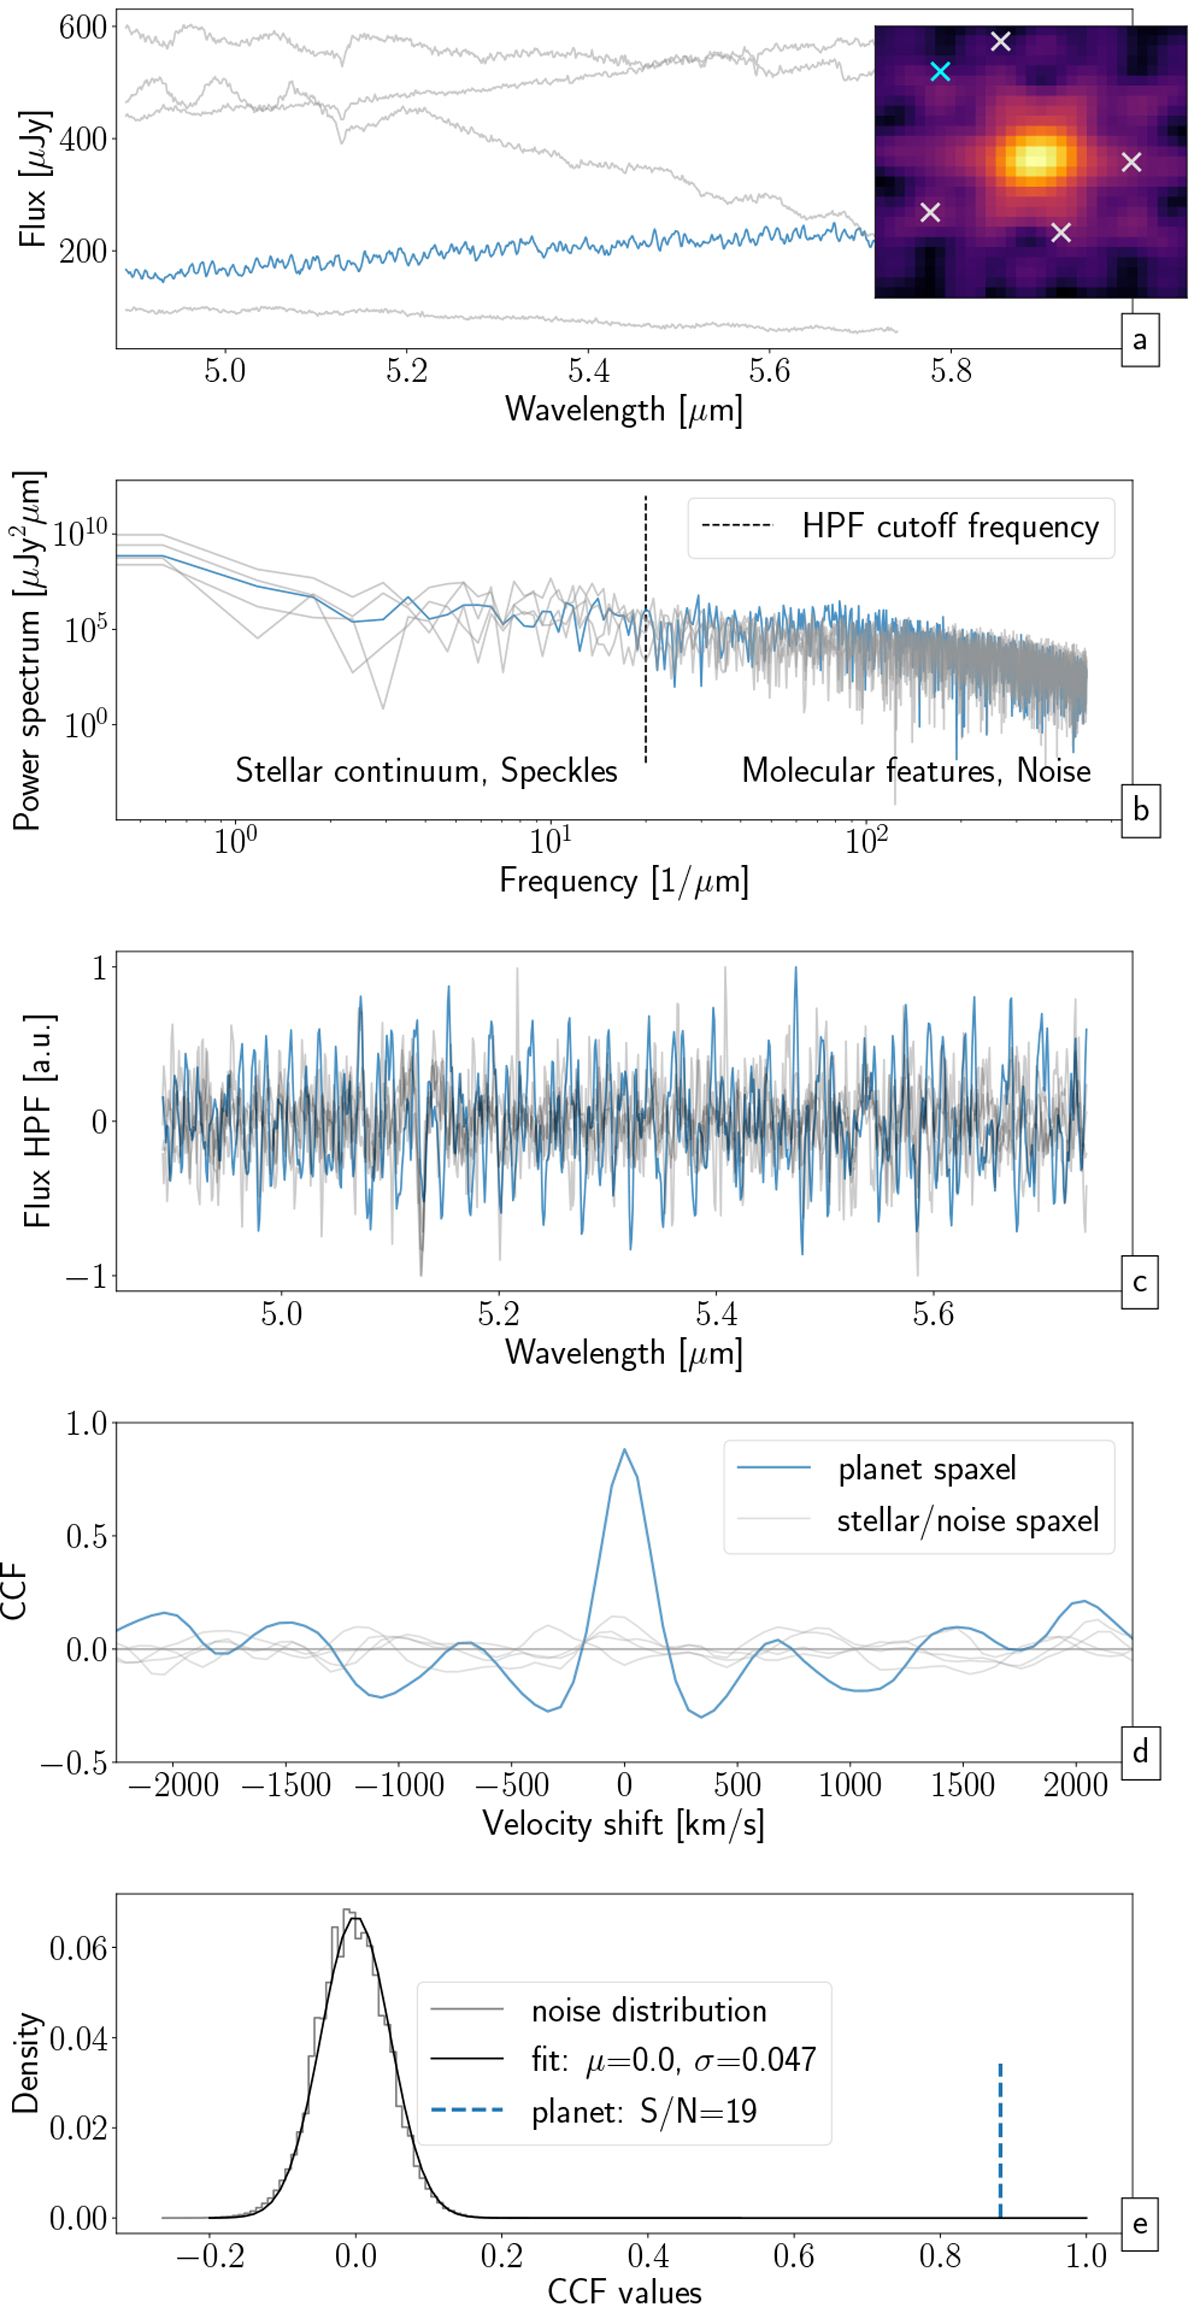
Processing steps of MRS reconstructed cubes for the application of the cross-correlation technique. (a) Spectra at different locations in the FoV of sub-band 1A of the HR8799 observation were selected as shown in the inset (image in log scale). The spaxel containing planet signal (in blue) is not directly visible in the cube and is dominated by the stellar PSF. (b) Power spectrum of the selected spectra. By visualising the frequency domain we can see where the high pass filter operates and distinguishes continuum contribution dominated by the star and high frequency components that contain the molecular absorption lines and residual noise. (c) High pass filtered and normalised flux. (d) Signal of the cross-correlation function where the input spectrum was used as a forward model. The planet spaxel clearly correlates with the forward model with a peak value of 0.88 (S∕N ~ 19). (e) S/Ncalculation for the cross-correlation method. All noise spaxels were considered and a Gaussian was fitted to the distribution to estimate the standard deviation that is used to estimate the S/N for a given cross-correlation value of the planet spaxel.
Current usage metrics show cumulative count of Article Views (full-text article views including HTML views, PDF and ePub downloads, according to the available data) and Abstracts Views on Vision4Press platform.
Data correspond to usage on the plateform after 2015. The current usage metrics is available 48-96 hours after online publication and is updated daily on week days.
Initial download of the metrics may take a while.