Fig. 8

Download original image
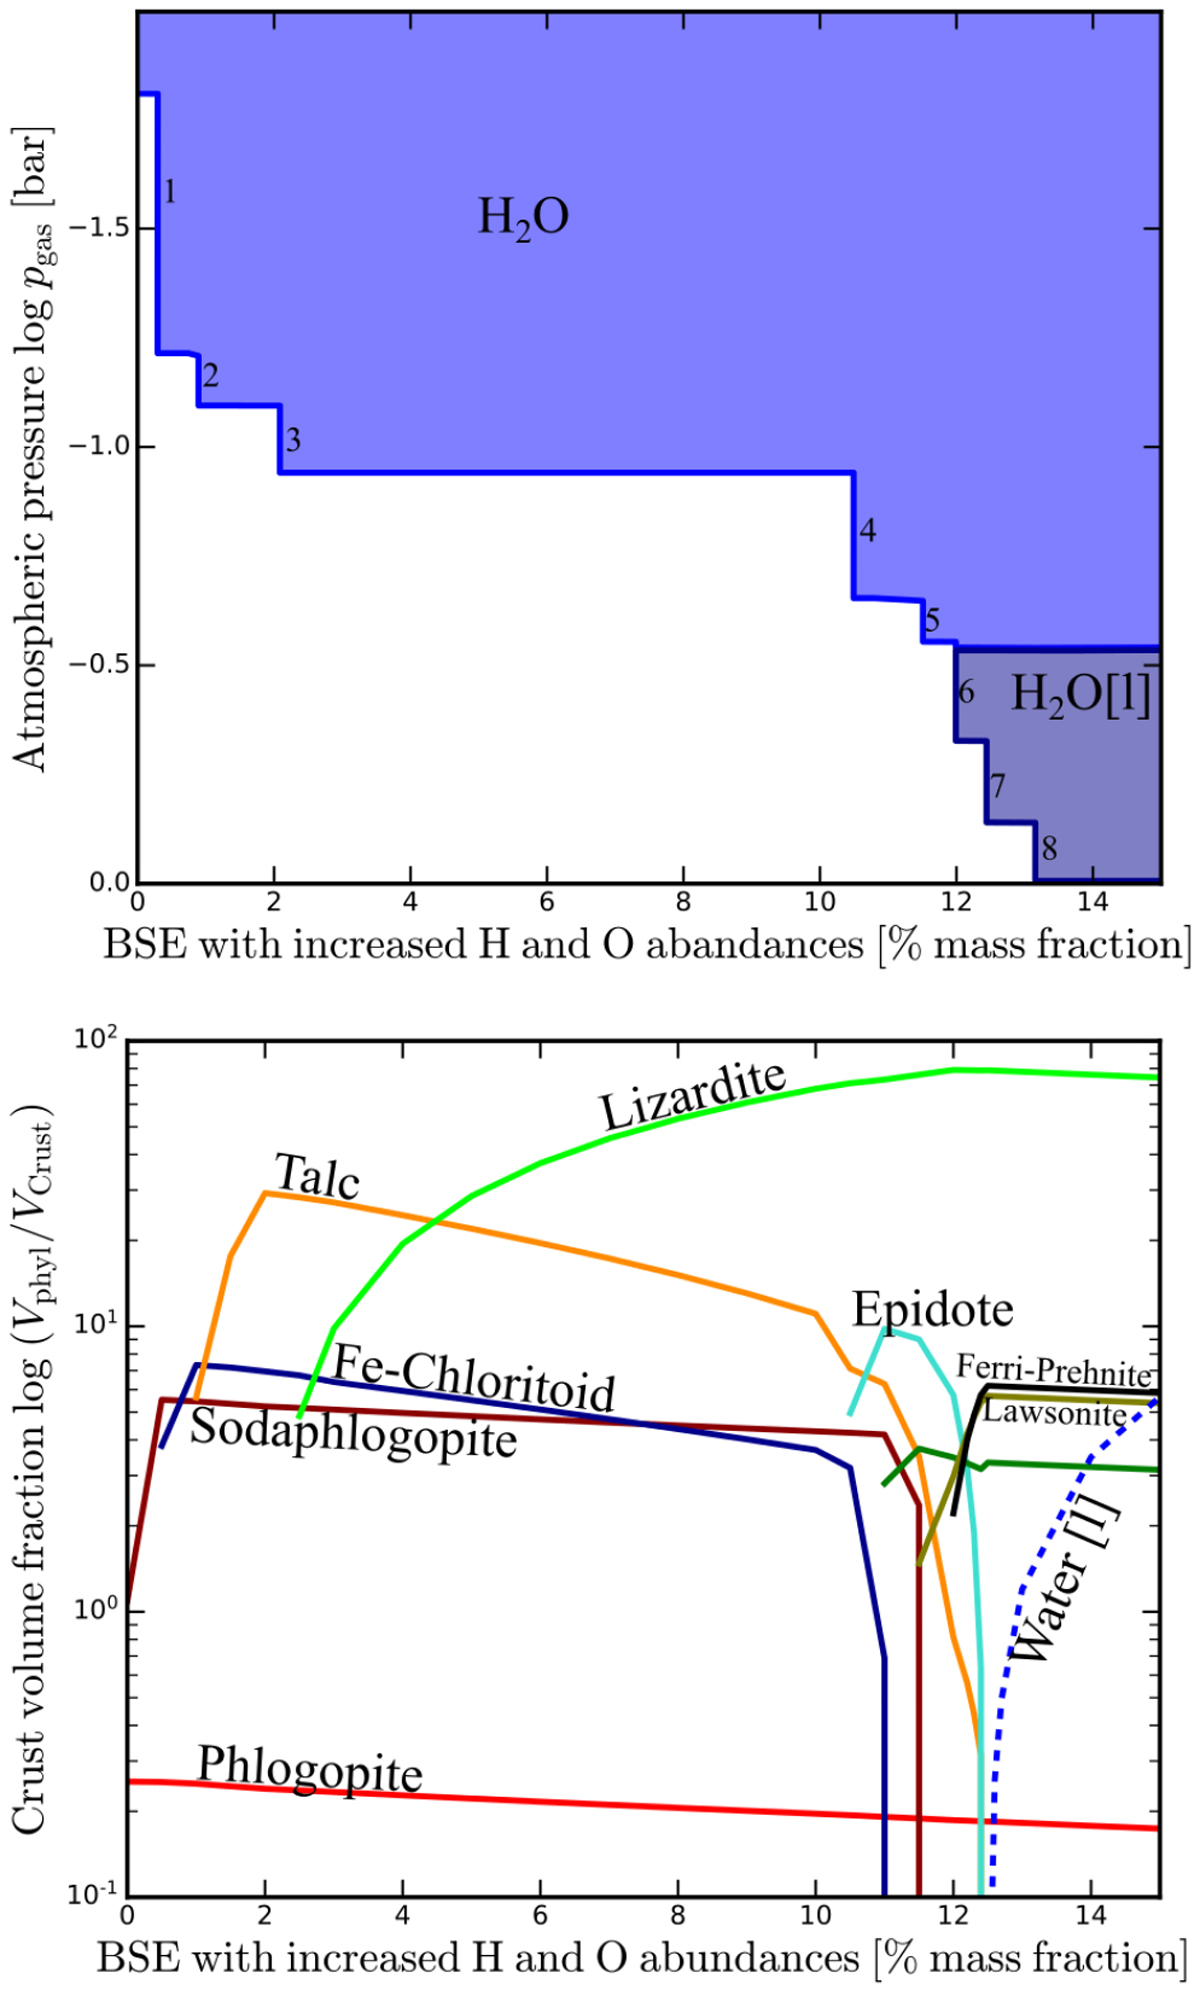
Influence of crust hydration on the water cloud base. The model is based on the BSE model, with increasing additional H and O abundances. The models are calculated for Tsurf = 350 K and psurf = 1 bar. Upper panel: pressure level of the water cloud base. Lower panel: crust volume fraction of different phyllosilicates. The sum formulas of the different condensate can be seen in Table 4.
Current usage metrics show cumulative count of Article Views (full-text article views including HTML views, PDF and ePub downloads, according to the available data) and Abstracts Views on Vision4Press platform.
Data correspond to usage on the plateform after 2015. The current usage metrics is available 48-96 hours after online publication and is updated daily on week days.
Initial download of the metrics may take a while.


