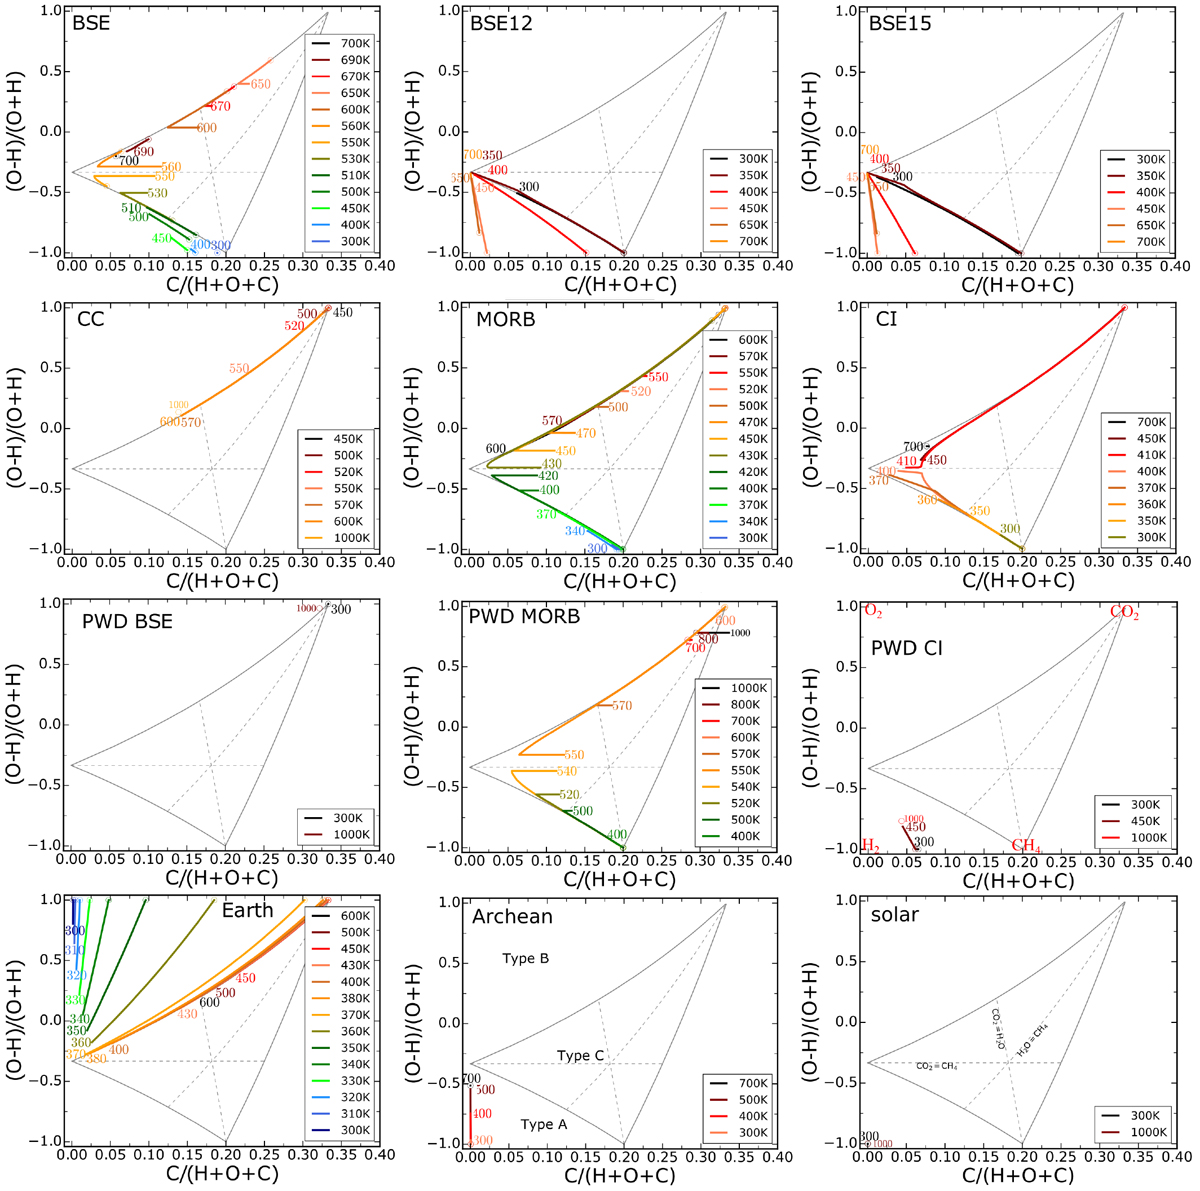
Fig. 7
Download original image
Atmospheric compositions with decreasing pressure and various surface temperatures. The base of each atmospheric profile is indicated by the corresponding Tsurf and the top by open circles. The axis of overall redox state measured from O and H abundances as (O-H)/(O+H) and C content relative to H, O, and C are the same as in Woitke et al. (2021). The atmospheric types, atmospheric end members of certain points as well as lines of equal abundances of certain molecules are indicated in the bottom right plots.
Current usage metrics show cumulative count of Article Views (full-text article views including HTML views, PDF and ePub downloads, according to the available data) and Abstracts Views on Vision4Press platform.
Data correspond to usage on the plateform after 2015. The current usage metrics is available 48-96 hours after online publication and is updated daily on week days.
Initial download of the metrics may take a while.