Fig. 6
Download original image
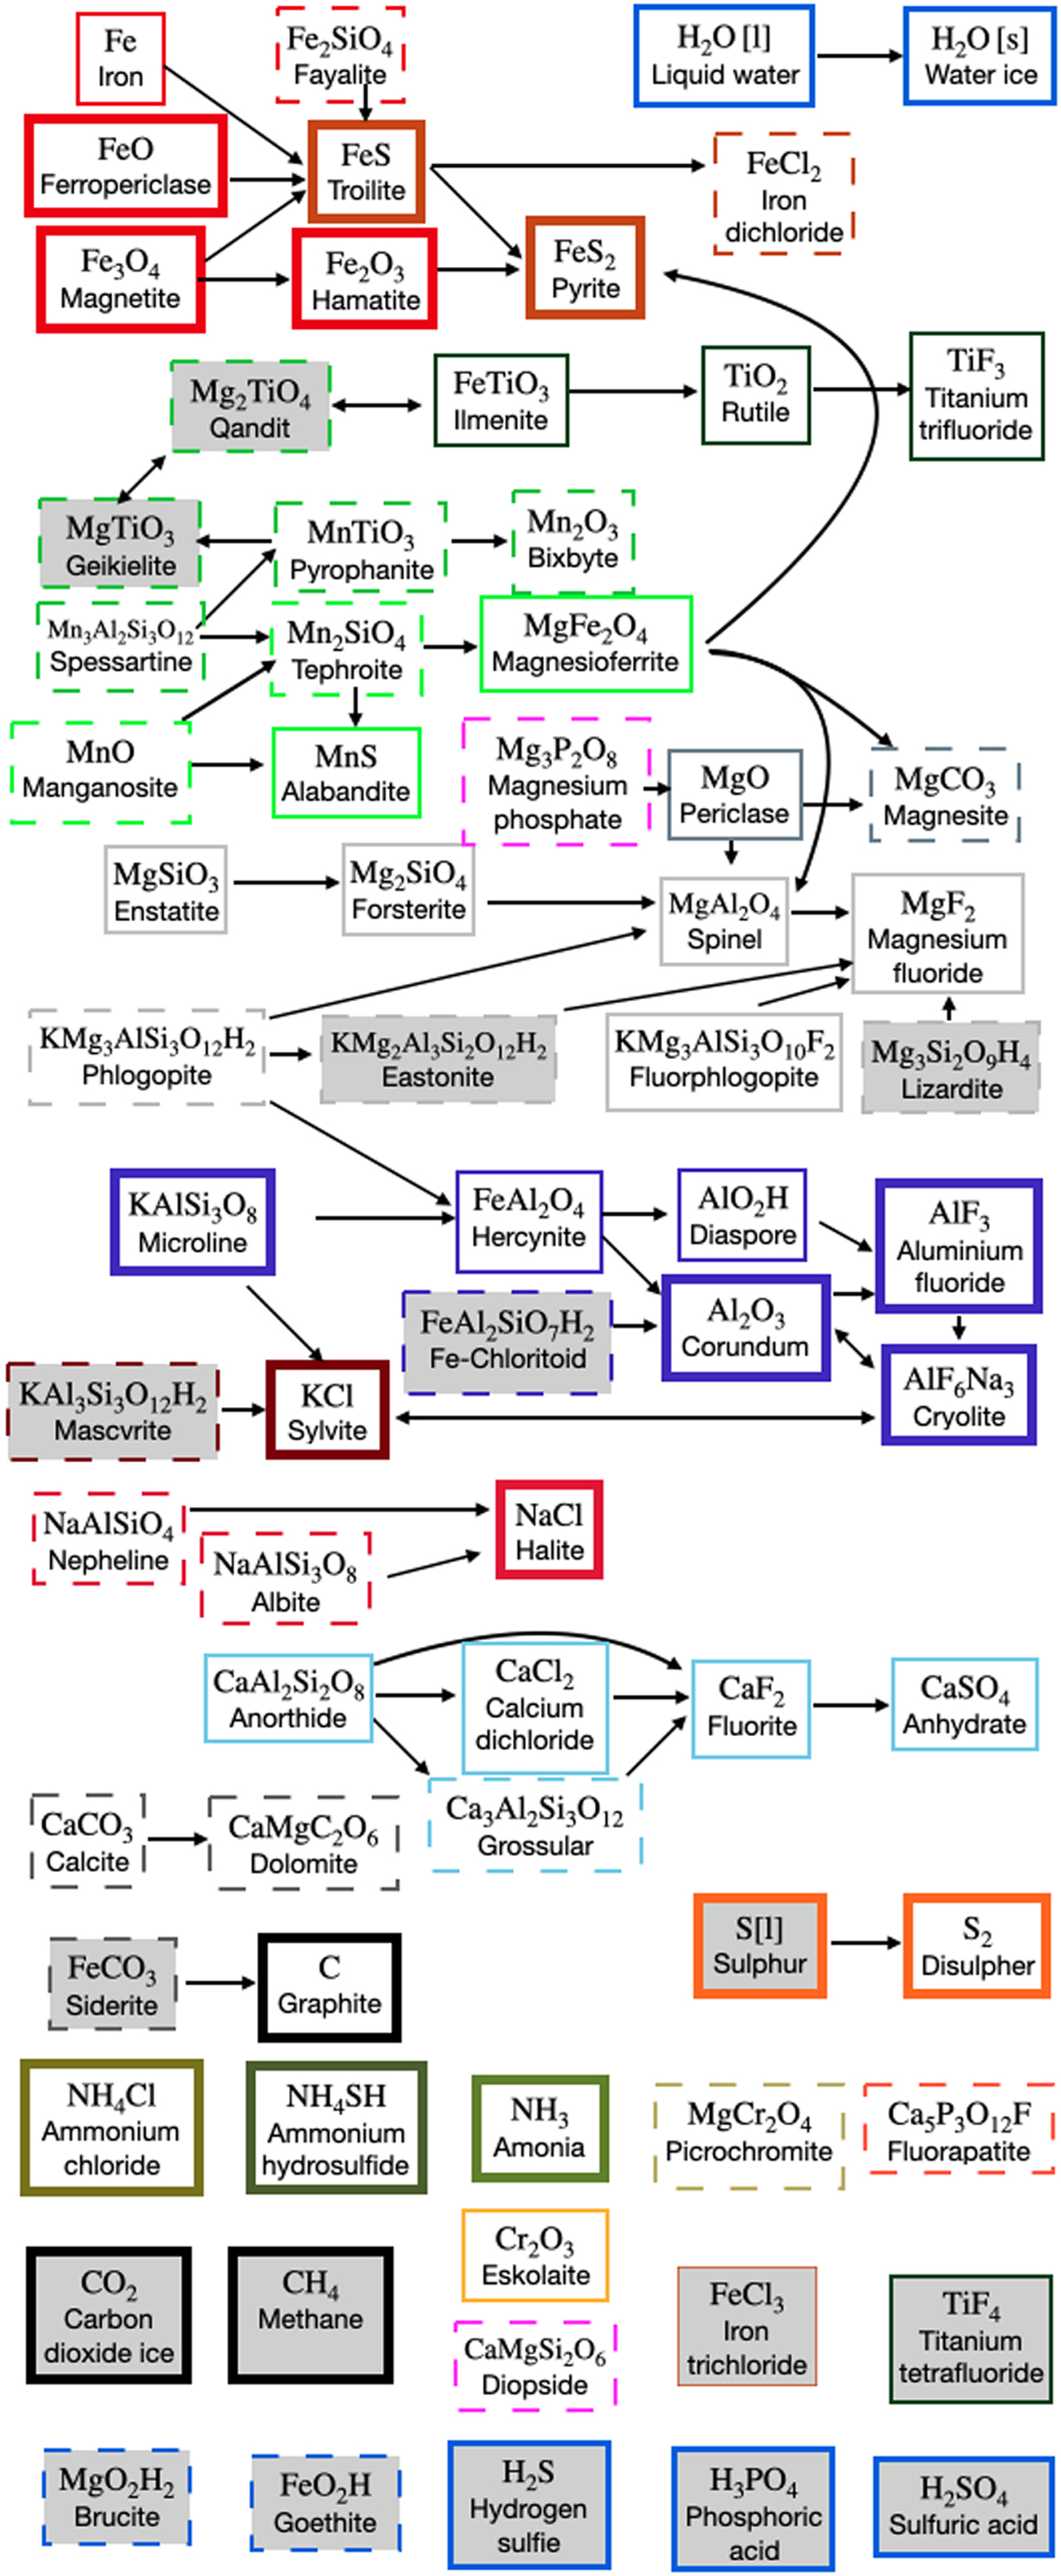
Overview of cloud material transitions in all of the models for materials with ncond ∕ntot > 10−20. Different box styles correspond to the peak abundance of the condensates as in Table 3 (ncond ∕ntot > 10−10 (thick), ncond∕ntot > 10−15 (thin), and ncond∕ntot > 10−20 (dashed)). The colours represent the different condensate chains. Along the arrows, the atmospheric pressure is decreasing and the condensates undergo a phase 2 transition (Woitke et al. 2018). Multiple arrows away from a specific condensate indicates that different transitions are found over the various models. For example FeS transitions to FeS2 in most models, but for BSE12 and Archean it also shows a transition to FeCl2. However, only one of them exists in any one model. Condensates without an arrow are not part of any condensate chain and do not undergo any phase 2 transition. Boxes with grey background refer to condensates that have only been found thermally stable in the high pressure models.
Current usage metrics show cumulative count of Article Views (full-text article views including HTML views, PDF and ePub downloads, according to the available data) and Abstracts Views on Vision4Press platform.
Data correspond to usage on the plateform after 2015. The current usage metrics is available 48-96 hours after online publication and is updated daily on week days.
Initial download of the metrics may take a while.