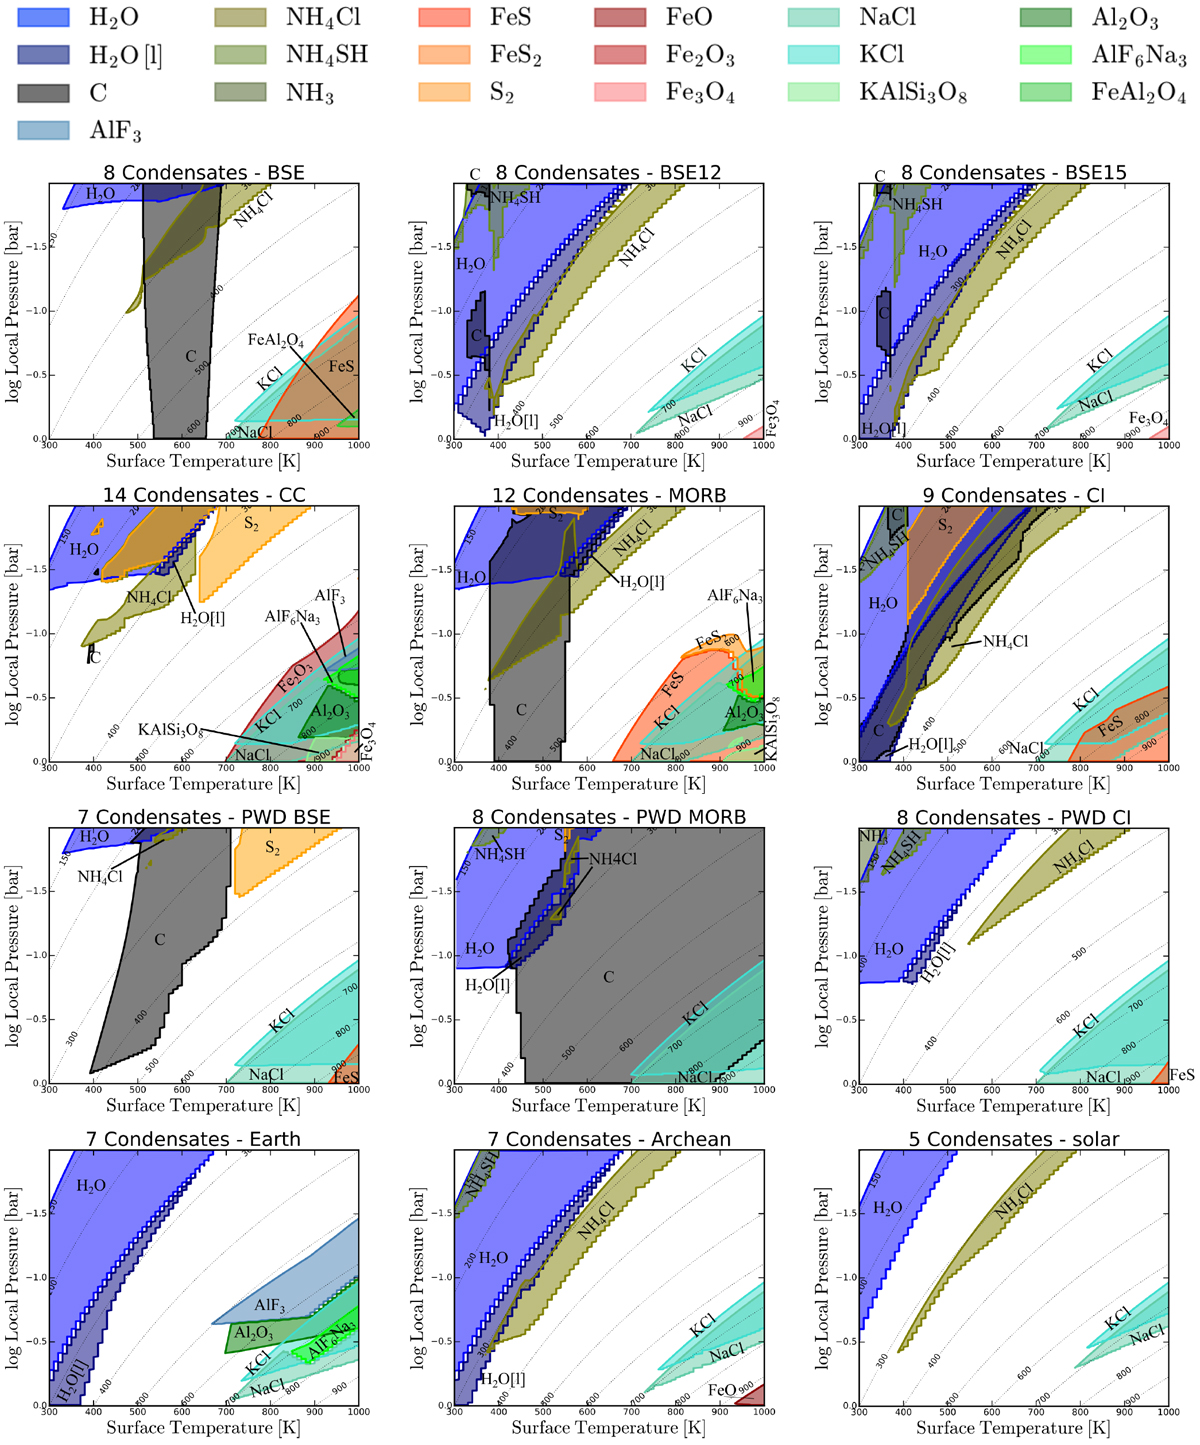
Fig. 4
Download original image
All thermally stable condensates with normalised number densities of ncond∕ntot > 10−10 locally for various elemental abundances are shown. The liquid phase of condensates is indicated by [l], while all other condensates are solids. Each column in every subplot is one bottom to top atmospheric model with the corresponding surface temperature on the x axis. Models have been calculated by steps of 10 K in Tsurf. The dottedlines refer to the local gas temperature of the atmosphere in Kelvin. All models are calculated for psurf =1 bar and γ = 1.25. The colour scheme for the cloud species is consistent for all element abundances and given in legend above.
Current usage metrics show cumulative count of Article Views (full-text article views including HTML views, PDF and ePub downloads, according to the available data) and Abstracts Views on Vision4Press platform.
Data correspond to usage on the plateform after 2015. The current usage metrics is available 48-96 hours after online publication and is updated daily on week days.
Initial download of the metrics may take a while.