Fig. 3
Download original image
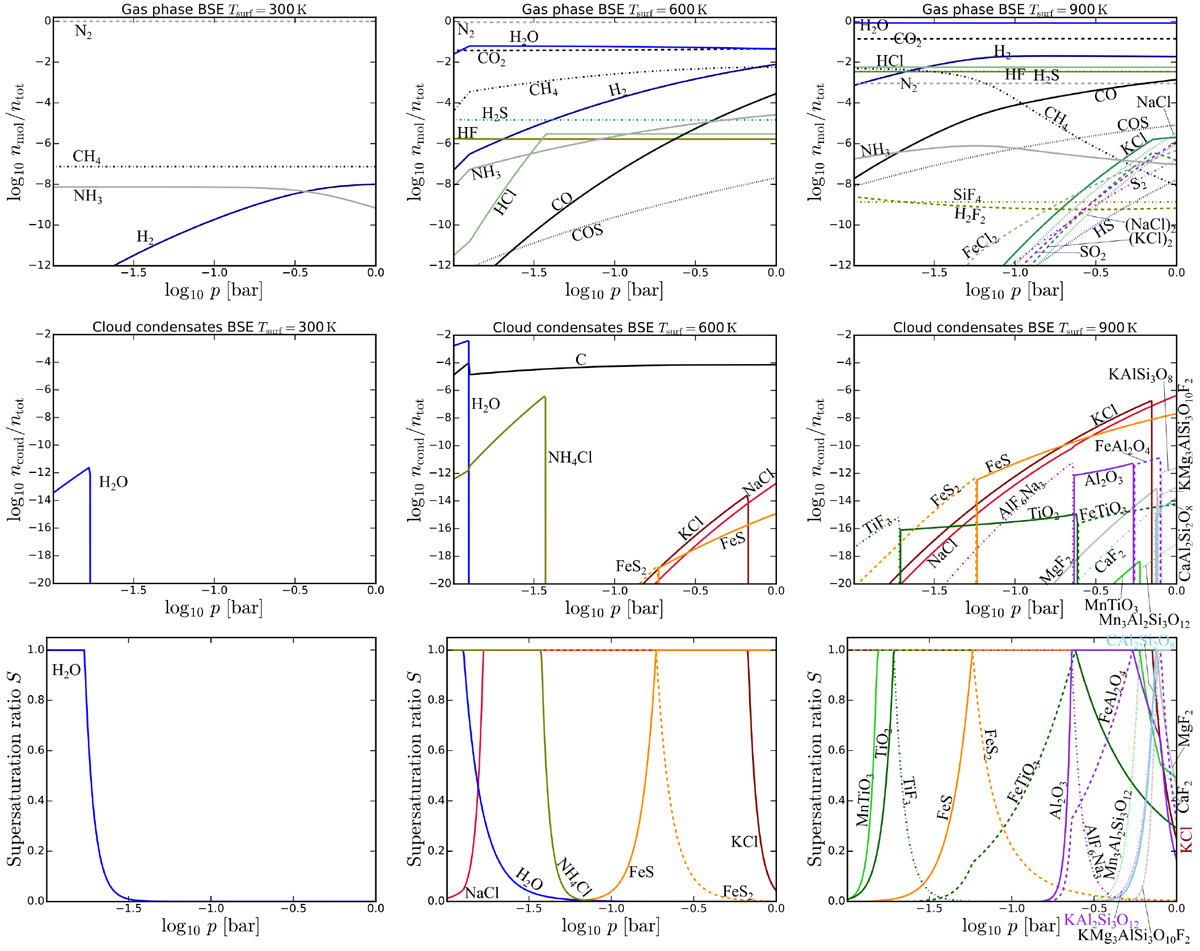
Atmospheric models for BSE total element abundances at different surface temperatures. Upper panels: gas composition, middle panels: cloud composition, lower panels: saturation levels. Left panels: Tsurf = 300 K, middle panels: Tsurf = 600 K, right panels: Tsurf = 900 K. All gas species that reach a concentration of at least 1 ppb somewhere in the atmosphere are shown. All cloud species down to a concentration of 10−20 are shown. The supersaturation ratios of all condensates in the middle panels are visualised in the respective lower panel. Condensates belonging to one condensate chain are depicted in one colour.
Current usage metrics show cumulative count of Article Views (full-text article views including HTML views, PDF and ePub downloads, according to the available data) and Abstracts Views on Vision4Press platform.
Data correspond to usage on the plateform after 2015. The current usage metrics is available 48-96 hours after online publication and is updated daily on week days.
Initial download of the metrics may take a while.