Free Access
Fig. C.2
Download original image
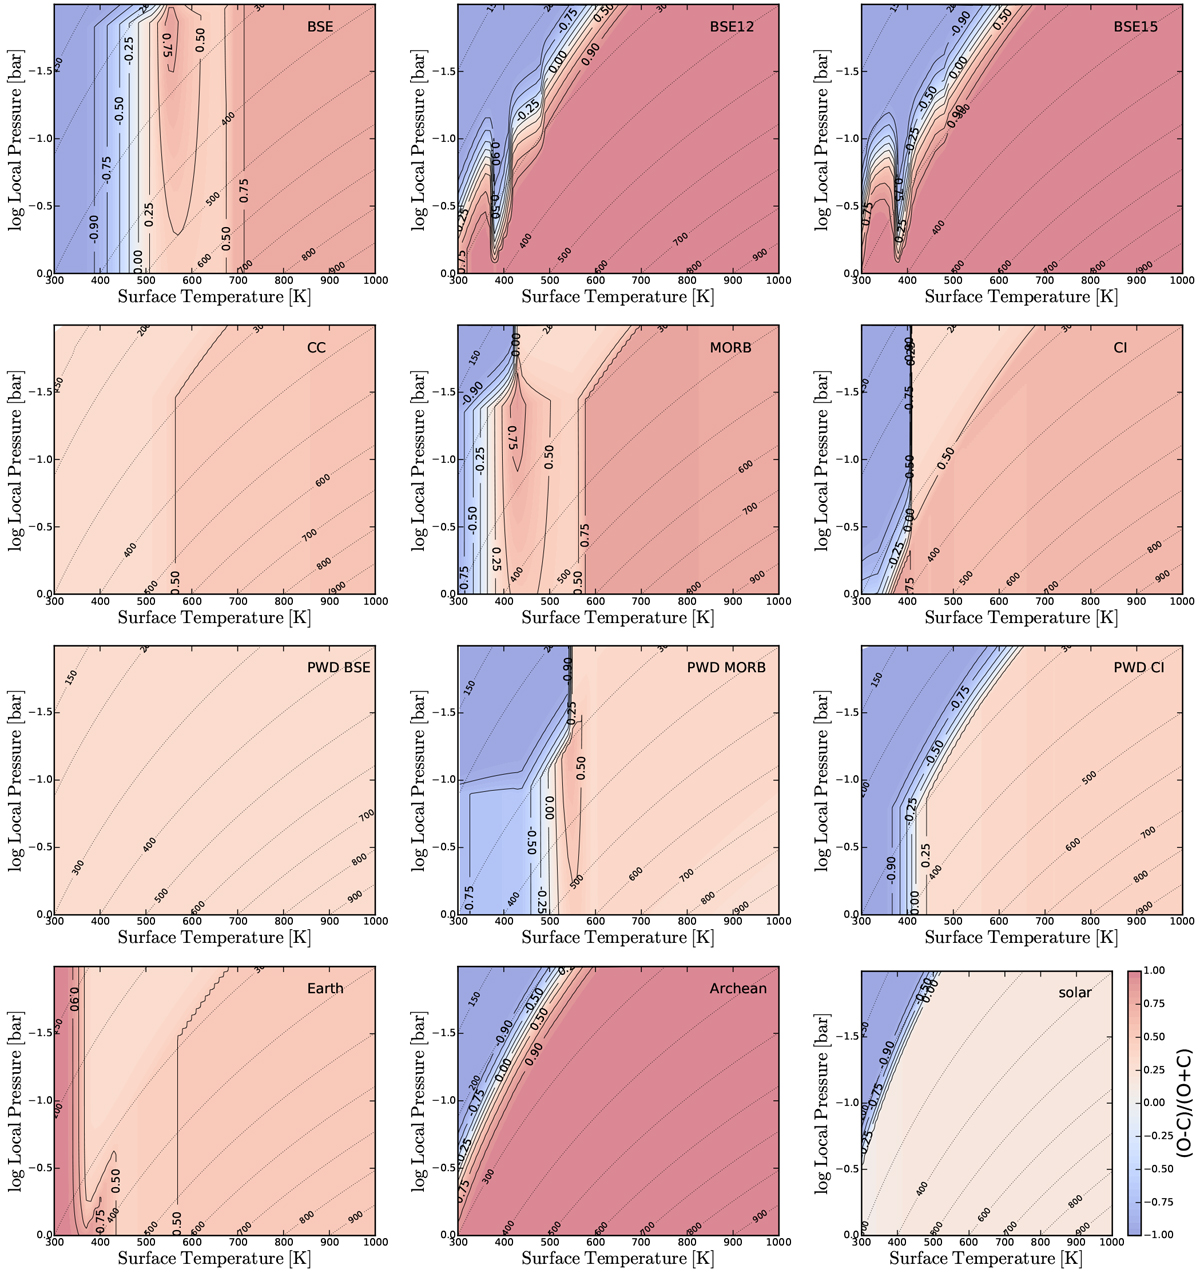
Comparison of the gas phase O and C abundances, expressed as the (O-C)/(O+C) ratio. Oxygen is dominant in the red regions, whereas carbon dominance is indicated in blue regions. The colour scheme is consistent for all panels. As in Fig. 4 the dotted lines indicate the local gas temperatures.
Current usage metrics show cumulative count of Article Views (full-text article views including HTML views, PDF and ePub downloads, according to the available data) and Abstracts Views on Vision4Press platform.
Data correspond to usage on the plateform after 2015. The current usage metrics is available 48-96 hours after online publication and is updated daily on week days.
Initial download of the metrics may take a while.