Fig. 8.
Download original image
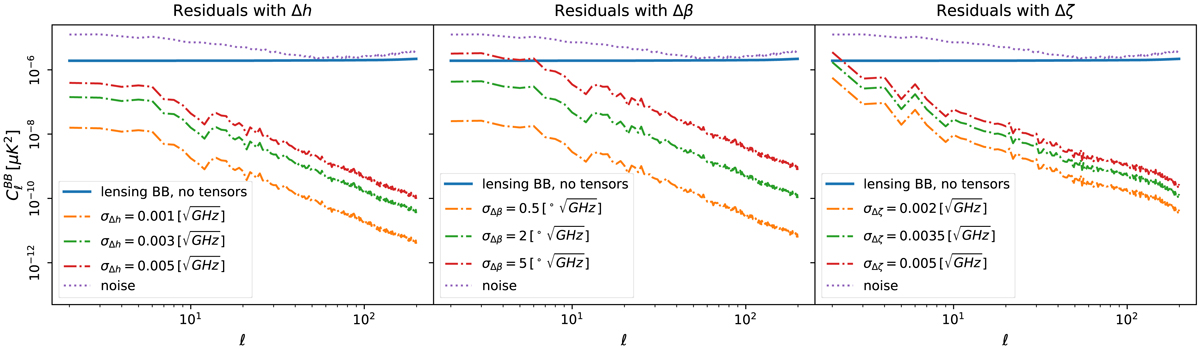
Residual BB power spectra for the frequency band centered at 140 GHz. The thick blue lines are the fiducial ![]() (CMB) (lensing BB, r = 0). The dashed-dotted lines show the residual spectra
(CMB) (lensing BB, r = 0). The dashed-dotted lines show the residual spectra ![]() obtained as the average over ten Gaussian error realizations of the perturbations applied to each systematic parameter. Different colors correspond to different values of the variance σΔx of the error realizations applied to the parameter x. The dotted line is the noise bias
obtained as the average over ten Gaussian error realizations of the perturbations applied to each systematic parameter. Different colors correspond to different values of the variance σΔx of the error realizations applied to the parameter x. The dotted line is the noise bias ![]() , as described in Sect. 5.4.
, as described in Sect. 5.4.
Current usage metrics show cumulative count of Article Views (full-text article views including HTML views, PDF and ePub downloads, according to the available data) and Abstracts Views on Vision4Press platform.
Data correspond to usage on the plateform after 2015. The current usage metrics is available 48-96 hours after online publication and is updated daily on week days.
Initial download of the metrics may take a while.