Fig. 4.
Download original image
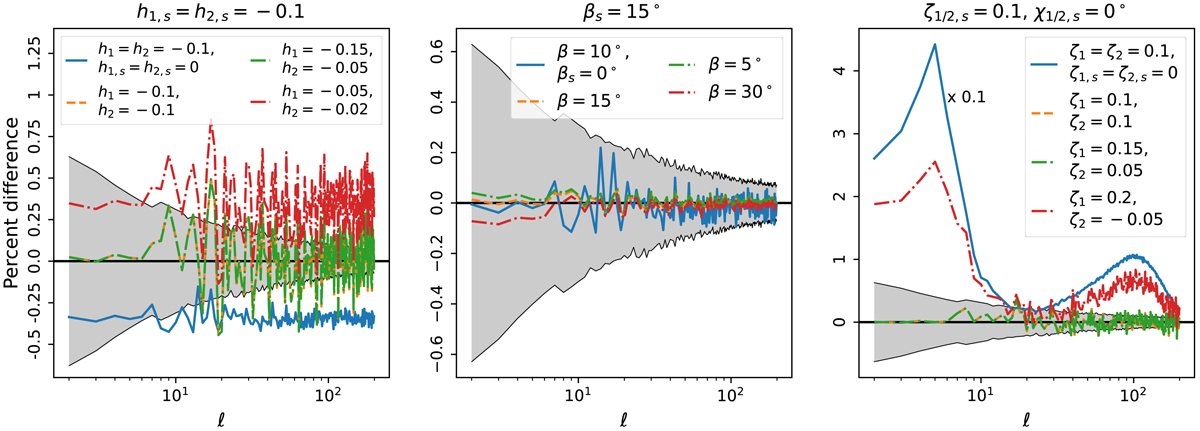
Percent difference of the noise de-biased ![]() (CMB + noise + systematics) with respect to the ideal
(CMB + noise + systematics) with respect to the ideal ![]() (CMB only), when assuming a non-ideal mapmaking matrix B. The shaded gray region shows the standard deviation of the ideal CMB realizations, normalized to their mean. The parameters with and without the subscript s enter the mapmaking matrix B/TOD matrix A. In each panel, we fix the value of each class of solver parameters (indicated in the corresponding title), except for the solid blue curve, showing (for reference) the case with non-ideal pointing matrix A and ideal mapmaking matrix B. In orange dashed lines, we report the results in the case A = B. In the dashed-dotted lines, we report the results in the case A ≠ B (different colors correspond to different values of the HWP parameters, see legend). In the right-most panel, the case with ideal B (blue solid) is divided by a factor of 10 with respect to the actual signal to ease the comparison with the other curves. The lines are wiggly because of the noise de-biasing. See the text for discussion.
(CMB only), when assuming a non-ideal mapmaking matrix B. The shaded gray region shows the standard deviation of the ideal CMB realizations, normalized to their mean. The parameters with and without the subscript s enter the mapmaking matrix B/TOD matrix A. In each panel, we fix the value of each class of solver parameters (indicated in the corresponding title), except for the solid blue curve, showing (for reference) the case with non-ideal pointing matrix A and ideal mapmaking matrix B. In orange dashed lines, we report the results in the case A = B. In the dashed-dotted lines, we report the results in the case A ≠ B (different colors correspond to different values of the HWP parameters, see legend). In the right-most panel, the case with ideal B (blue solid) is divided by a factor of 10 with respect to the actual signal to ease the comparison with the other curves. The lines are wiggly because of the noise de-biasing. See the text for discussion.
Current usage metrics show cumulative count of Article Views (full-text article views including HTML views, PDF and ePub downloads, according to the available data) and Abstracts Views on Vision4Press platform.
Data correspond to usage on the plateform after 2015. The current usage metrics is available 48-96 hours after online publication and is updated daily on week days.
Initial download of the metrics may take a while.