Fig. 3.

Download original image
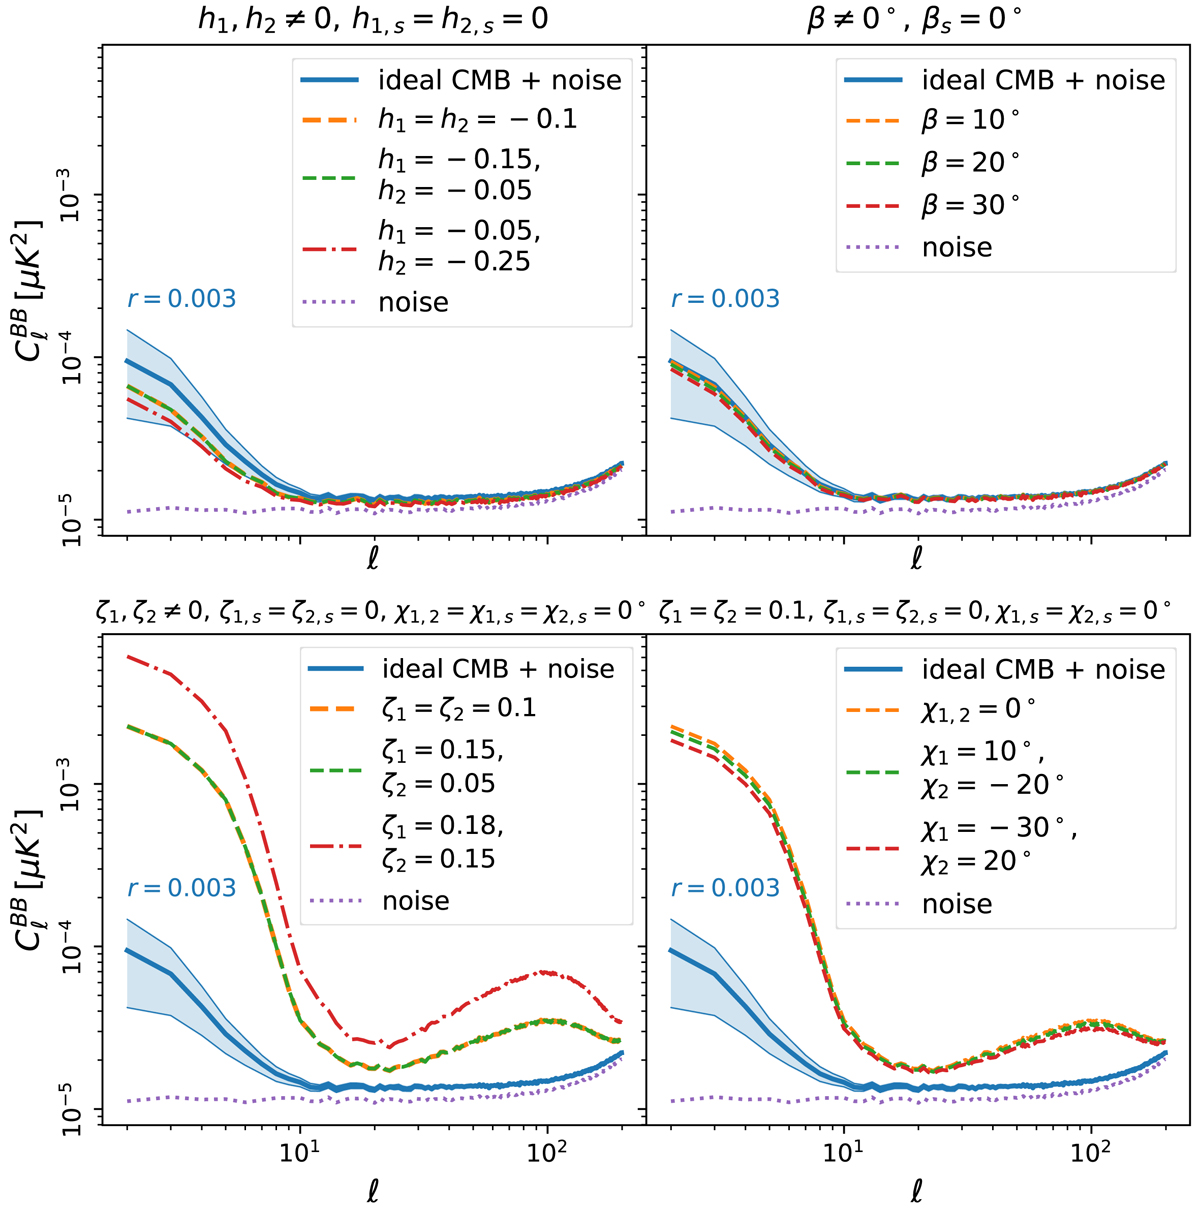
![]() power spectra with CMB only (no foregrounds) and noise simulations. This figure summarizes the results in the case of ideal map-making matrix B (ideal HWP). We report in blue the CMB (with r = 0.003) + noise spectra in the ideal case (TOD matrix equal to the mapmaking matrix, A = B). The standard deviation of the 100 ideal CMB realizations is shown as a shaded blue region. Spectra from the output maps obtained with the choice A ≠ B→ (systematic+noise) are shown in dashed-dotted and dashed lines. In the case of h (or ζ), the dashed lines have the same h1 + h2 (or ζ1 + ζ2), whereas this sum is different in the case shown in the dashed-dotted lines: we see that the dashed lines are overlapping, as the 2θ terms in Eq. (28) and (30) are canceled out in the mapmaking process. The noise bias is shown in dotted. In the case of ideal B, the noise bias is the same regardless from the parameter perturbed. We refer to the main text for a more detailed discussion.
power spectra with CMB only (no foregrounds) and noise simulations. This figure summarizes the results in the case of ideal map-making matrix B (ideal HWP). We report in blue the CMB (with r = 0.003) + noise spectra in the ideal case (TOD matrix equal to the mapmaking matrix, A = B). The standard deviation of the 100 ideal CMB realizations is shown as a shaded blue region. Spectra from the output maps obtained with the choice A ≠ B→ (systematic+noise) are shown in dashed-dotted and dashed lines. In the case of h (or ζ), the dashed lines have the same h1 + h2 (or ζ1 + ζ2), whereas this sum is different in the case shown in the dashed-dotted lines: we see that the dashed lines are overlapping, as the 2θ terms in Eq. (28) and (30) are canceled out in the mapmaking process. The noise bias is shown in dotted. In the case of ideal B, the noise bias is the same regardless from the parameter perturbed. We refer to the main text for a more detailed discussion.
Current usage metrics show cumulative count of Article Views (full-text article views including HTML views, PDF and ePub downloads, according to the available data) and Abstracts Views on Vision4Press platform.
Data correspond to usage on the plateform after 2015. The current usage metrics is available 48-96 hours after online publication and is updated daily on week days.
Initial download of the metrics may take a while.


