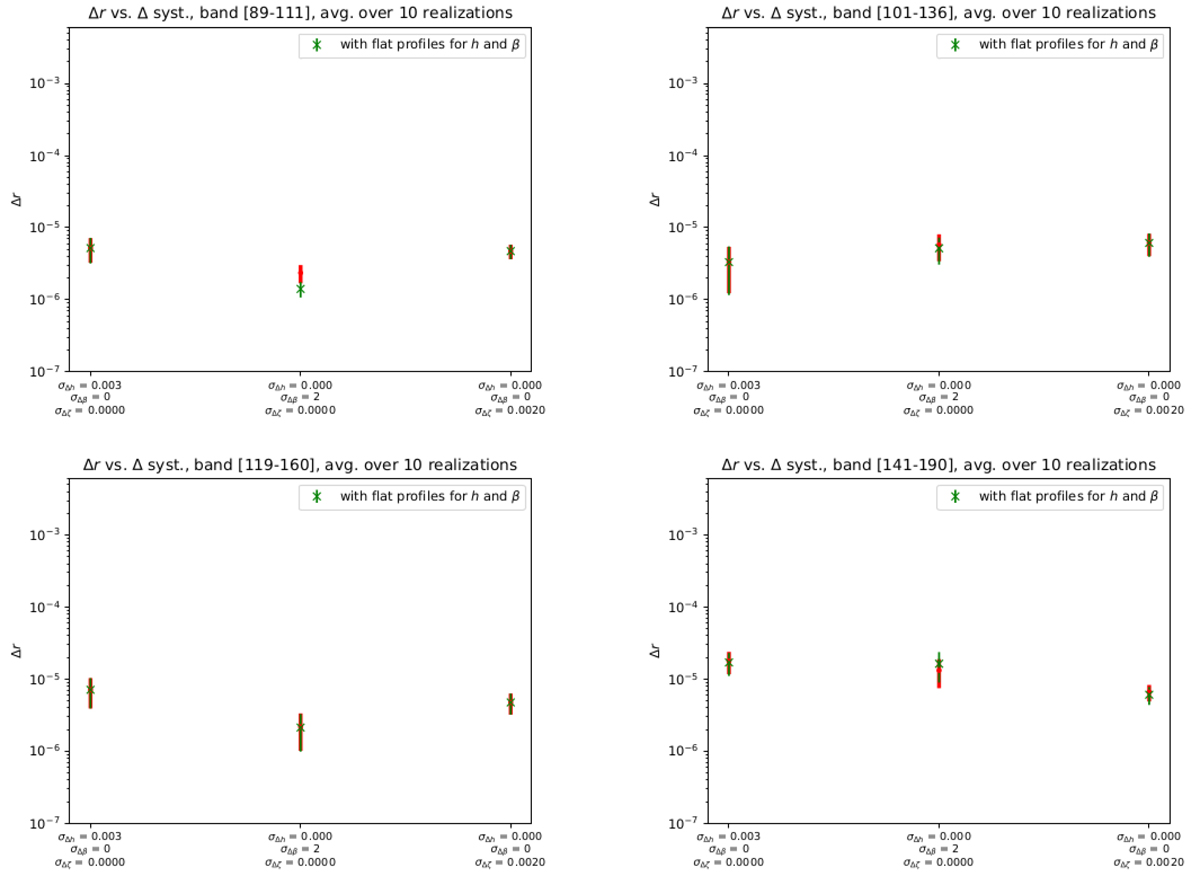
Fig. C.1.
Download original image
Comparison between the Δr obtained with constant parameters and those obtained with the simulated profiles, in four MFT bands. In each case, only one systematics X ∈ {h, β, ζ} is perturbed with the σX indicated in the label. The red points refer to the case with simulated profiles, the green crosses to the case with constant ones.
Current usage metrics show cumulative count of Article Views (full-text article views including HTML views, PDF and ePub downloads, according to the available data) and Abstracts Views on Vision4Press platform.
Data correspond to usage on the plateform after 2015. The current usage metrics is available 48-96 hours after online publication and is updated daily on week days.
Initial download of the metrics may take a while.