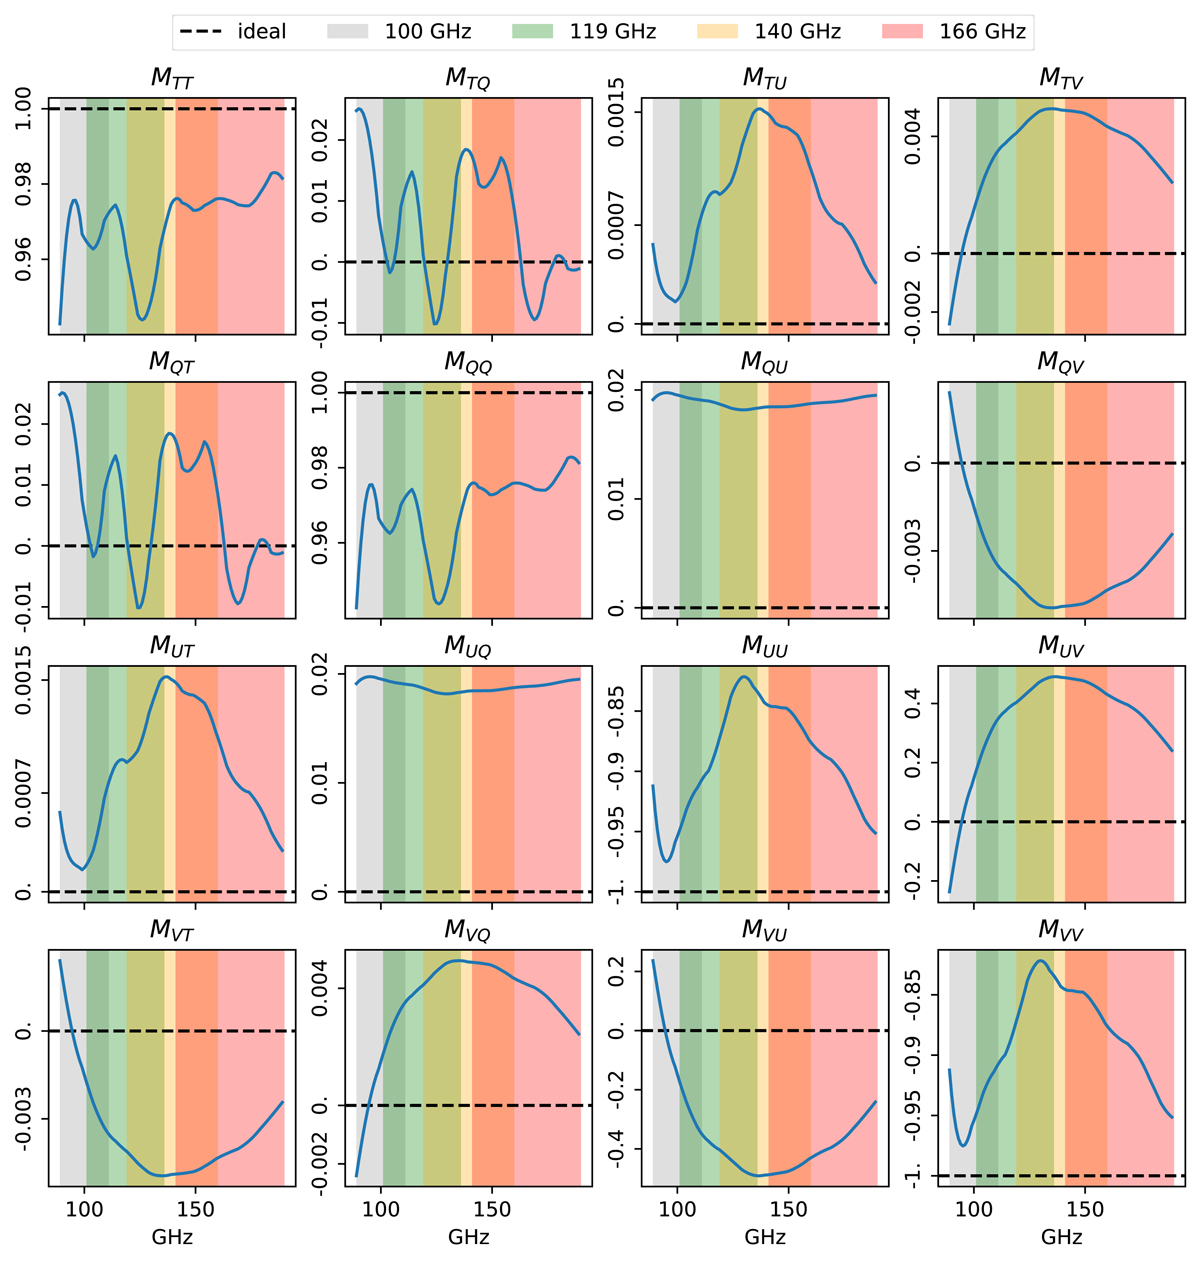
Fig. A.1.
Download original image
Graphical representation of the Mueller matrix of a non-ideal HWP. Each panel corresponds to the profile of a matrix element as a function of frequency. We used the simulated profiles of h and β for the MFT bands, while we fix ζ1, 2 = 0.01 and χ1, 2 = 0. The black dashed line represents the case of an ideal HWP, the shaded vertical bands correspond to the four MFT bands, labeled by their central value. The non-diagonal blocks do not vanish as a result of ζ1, 2 ≠ 0 (see Eq. A.2).
Current usage metrics show cumulative count of Article Views (full-text article views including HTML views, PDF and ePub downloads, according to the available data) and Abstracts Views on Vision4Press platform.
Data correspond to usage on the plateform after 2015. The current usage metrics is available 48-96 hours after online publication and is updated daily on week days.
Initial download of the metrics may take a while.