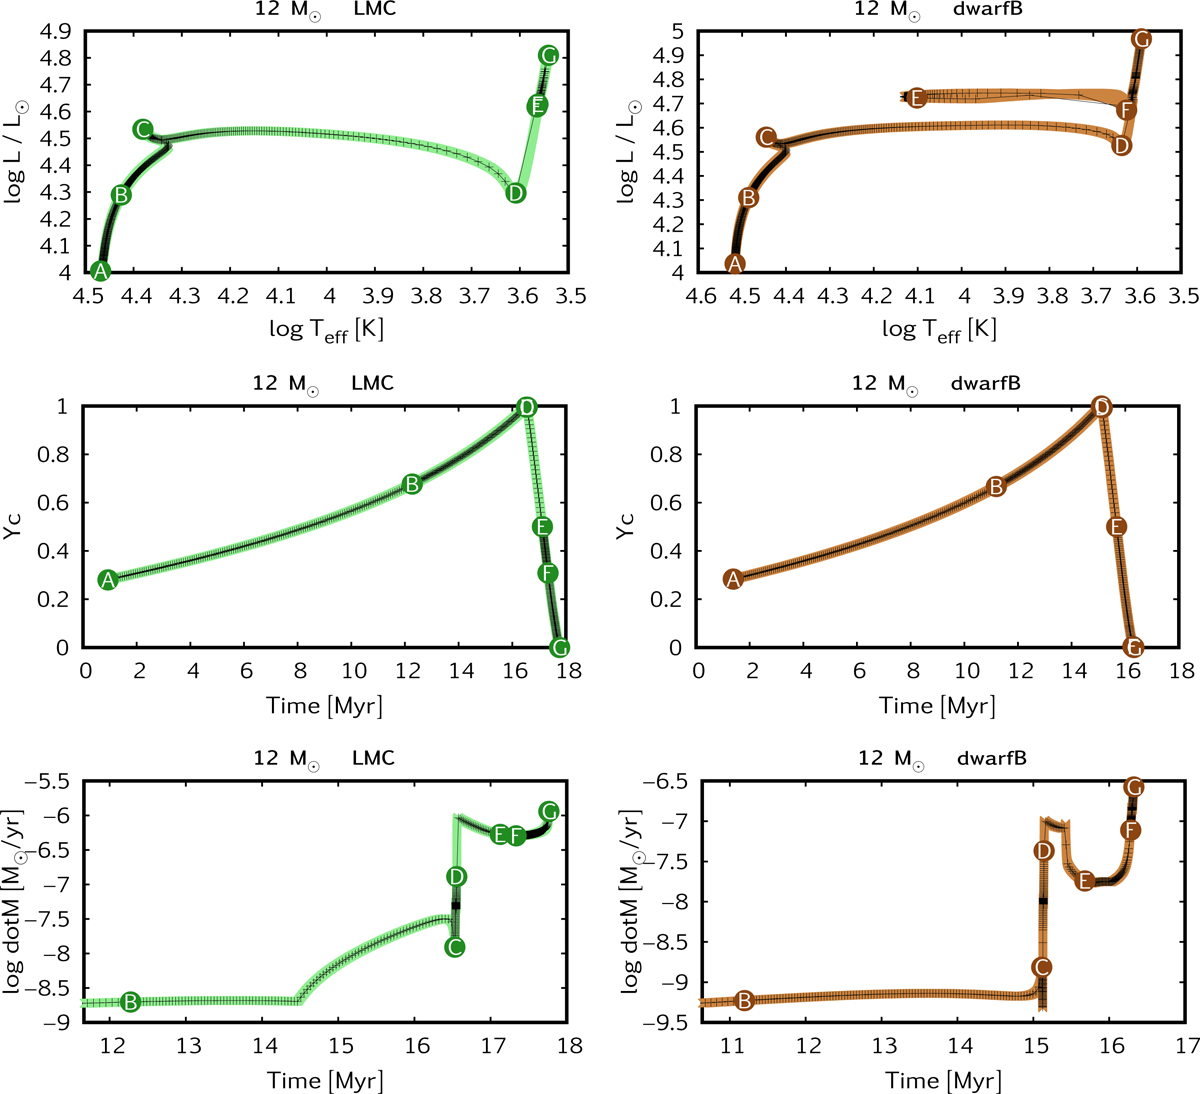
Fig. 5.
Download original image
Position of EEPs (i.e., fixed points in evolution) during the lifetime of some typical models. Colored lines represent the original output of our computations with the Bonn code, and black lines and crosses mark the filtered version (consistently containing the same number of dots between EEPs). The seven EEPs are labeled A–G; our method of choosing them is explained in the text.
Current usage metrics show cumulative count of Article Views (full-text article views including HTML views, PDF and ePub downloads, according to the available data) and Abstracts Views on Vision4Press platform.
Data correspond to usage on the plateform after 2015. The current usage metrics is available 48-96 hours after online publication and is updated daily on week days.
Initial download of the metrics may take a while.