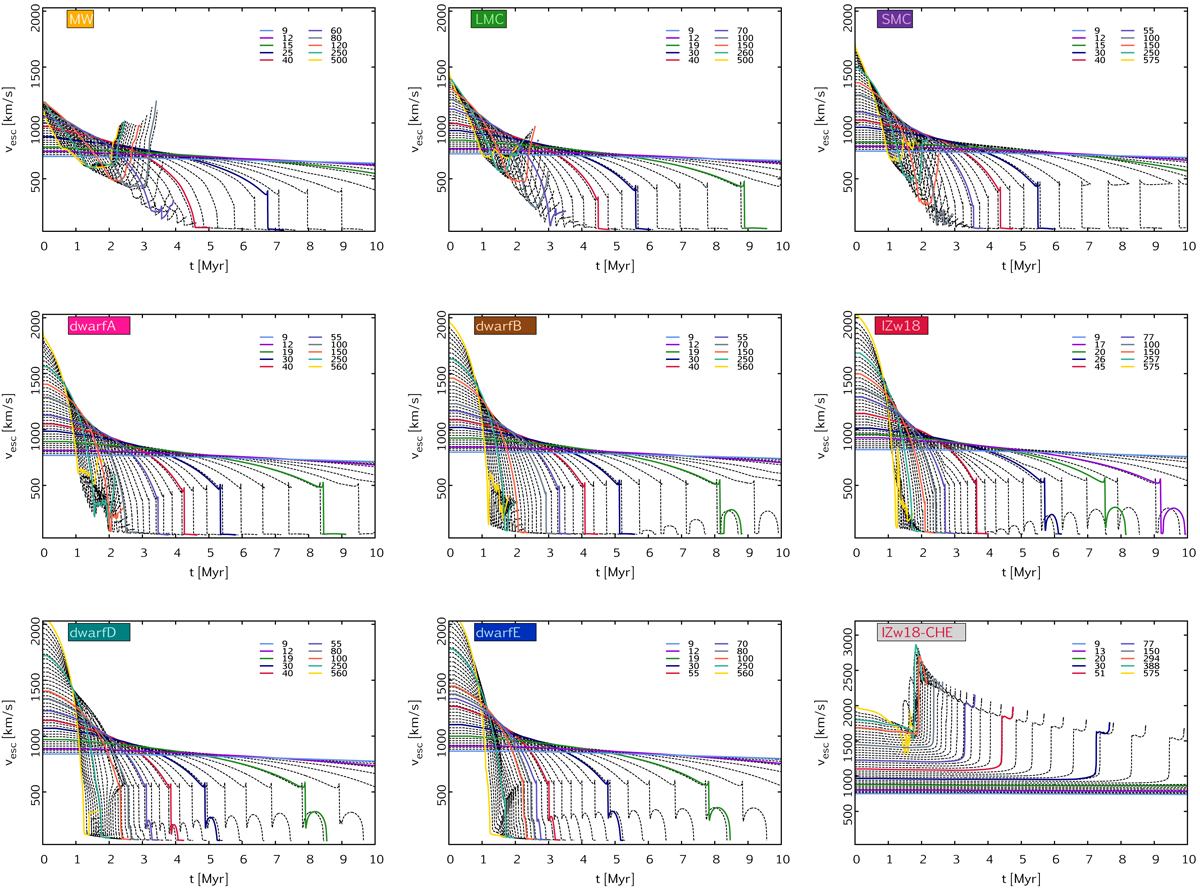
Fig. 3.
Download original image
Time evolution of the escape velocity; cf. Eq. (1). The initial mass is color-coded (between 9 and ∼500 M⊙). The dashed black lines represent interpolated tracks (up to 500 M⊙); cf. Figs. 1 and 2. While here only shown until 10 Myr, the files published in the BoOST project contain data until the end of the lifetimes of the longest-living model in the population (∼30 Myr).
Current usage metrics show cumulative count of Article Views (full-text article views including HTML views, PDF and ePub downloads, according to the available data) and Abstracts Views on Vision4Press platform.
Data correspond to usage on the plateform after 2015. The current usage metrics is available 48-96 hours after online publication and is updated daily on week days.
Initial download of the metrics may take a while.