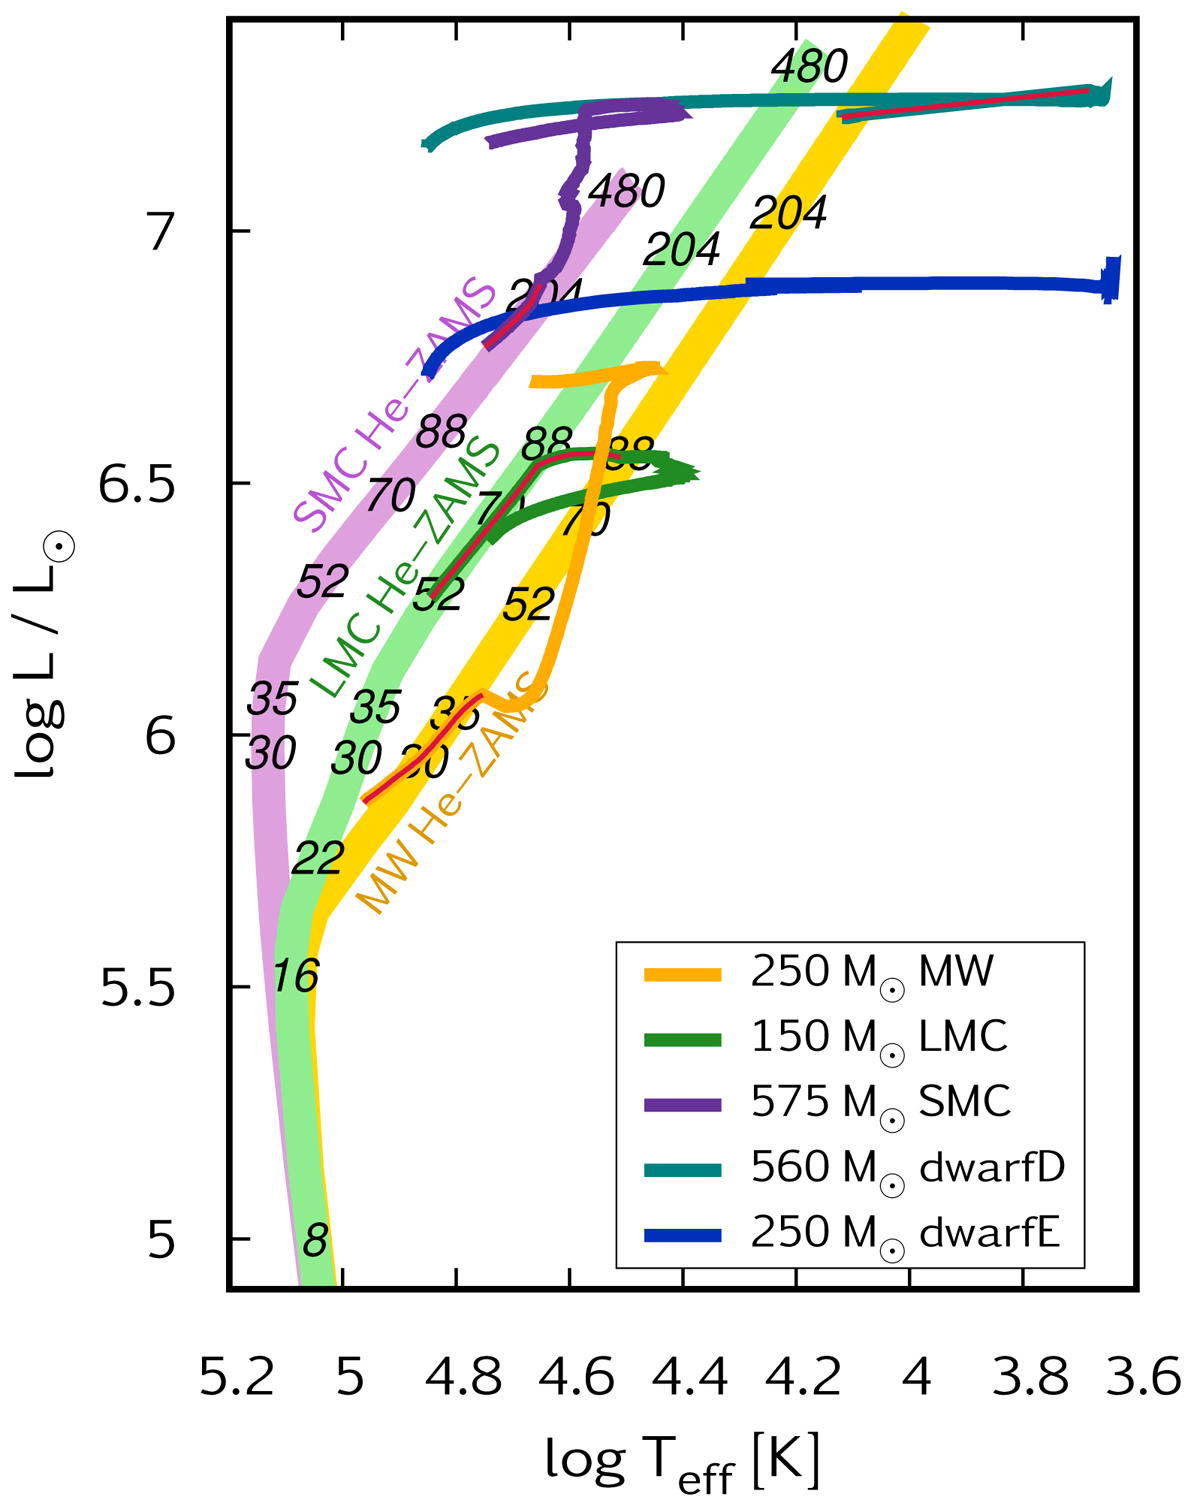
Fig. 10.
Download original image
Example of the results of the direct extension method (Sect. 4). The complete evolution of five stellar models (see the key legend) is plotted. The direct extension phase (typically lasting for 9% of the lifetime of these particular models) is marked with red in four of them (MW, LMC, SMC, and dwarfD); the fifth model (dwarfE) was properly computed without interruption, and is shown here as reference. During the direct extension phase, the models converge to their corresponding helium ZAMS position while loosing mass from their surface layers (cf. Sect. 4.3). Helium ZAMS positions in the HR diagram are shown for MW, LMC, and SMC compositions. The details of constructing these lines are given in Appendix B.1. Numbering indicates stellar masses (in M⊙).
Current usage metrics show cumulative count of Article Views (full-text article views including HTML views, PDF and ePub downloads, according to the available data) and Abstracts Views on Vision4Press platform.
Data correspond to usage on the plateform after 2015. The current usage metrics is available 48-96 hours after online publication and is updated daily on week days.
Initial download of the metrics may take a while.