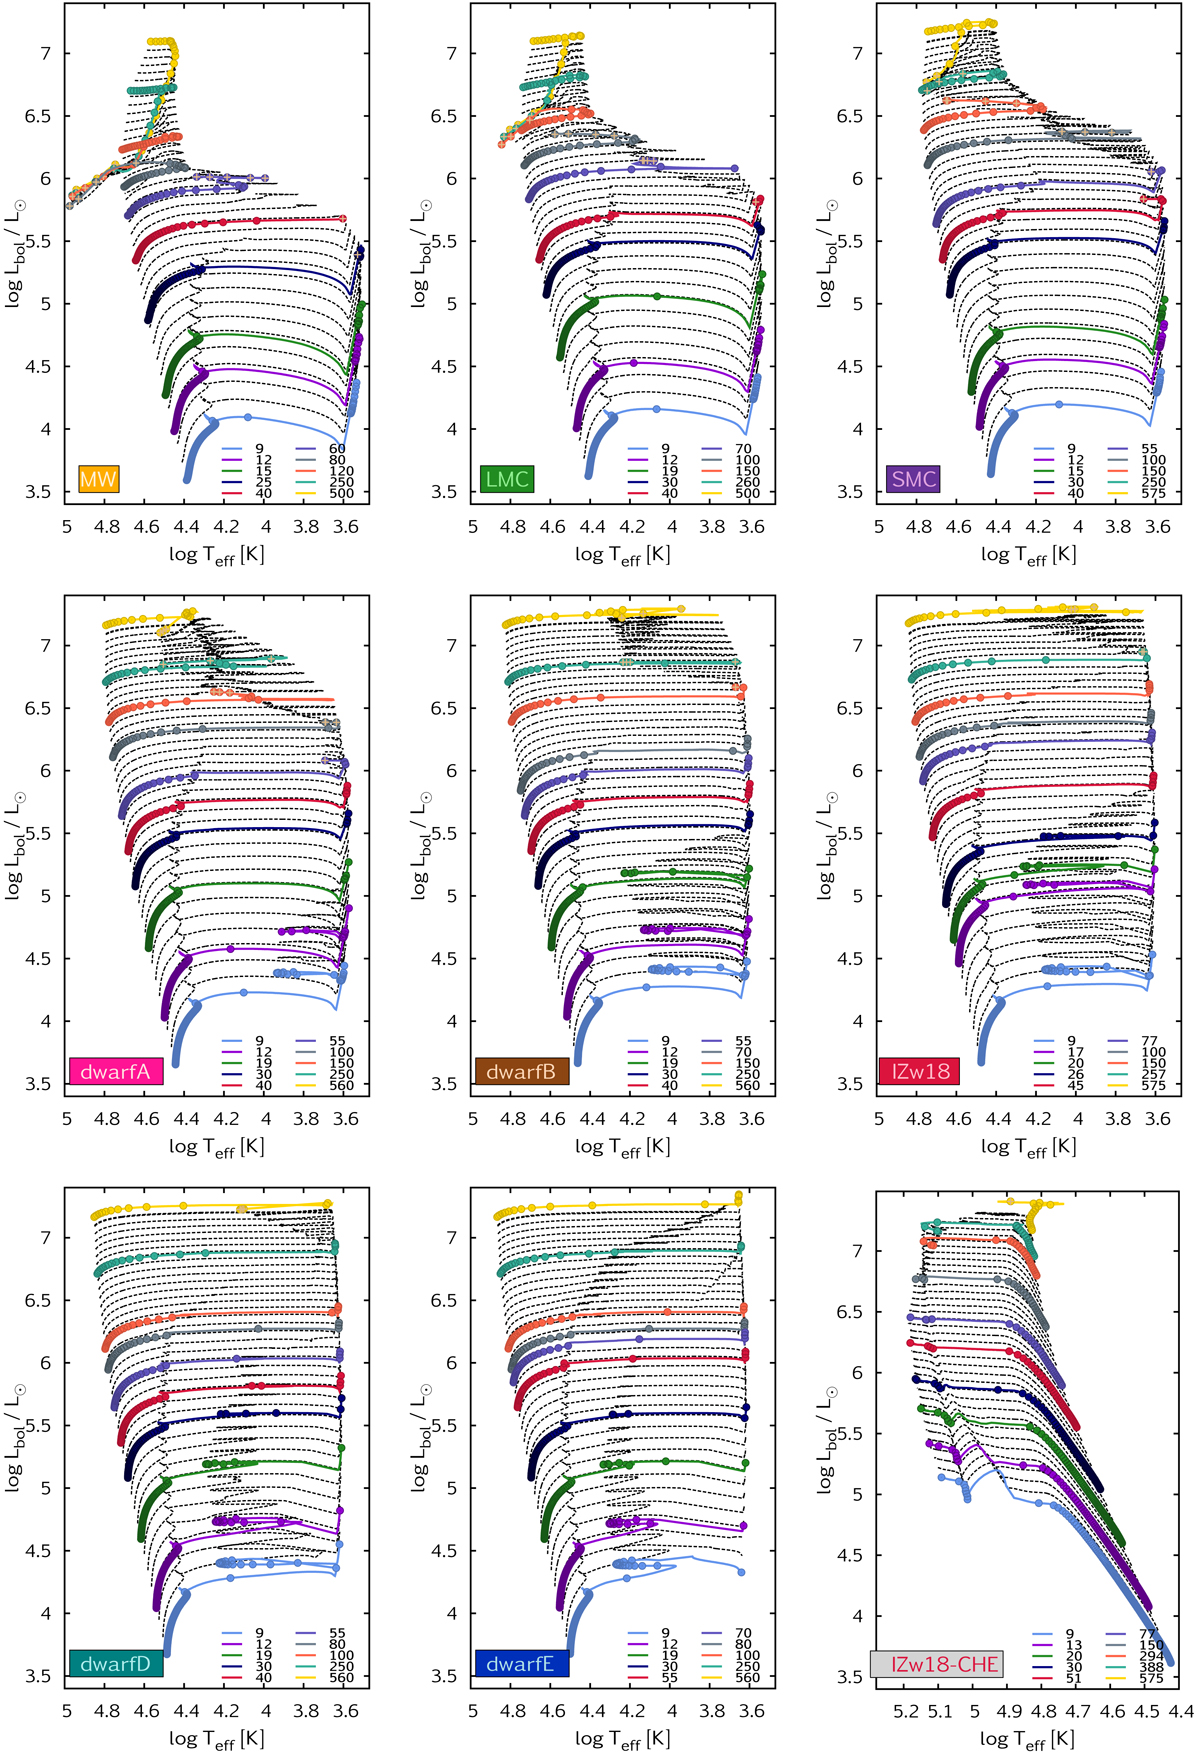
Fig. 1.
Download original image
Hertzsprung–Russell diagrams. Initial mass is color-coded (between 9 and ∼500 M⊙); dots mark every 105 yr of evolution along the stellar models. Dashed black lines represent interpolated tracks (up to 500 M⊙); brown crosses mark the phases in which the direct extension method (Sect. 4) has been applied. For details about the models and their postprocessing, see Sects. 2 and 4, respectively, and for details about the interpolated tracks, see Sect. 3.
Current usage metrics show cumulative count of Article Views (full-text article views including HTML views, PDF and ePub downloads, according to the available data) and Abstracts Views on Vision4Press platform.
Data correspond to usage on the plateform after 2015. The current usage metrics is available 48-96 hours after online publication and is updated daily on week days.
Initial download of the metrics may take a while.