Fig. 4.
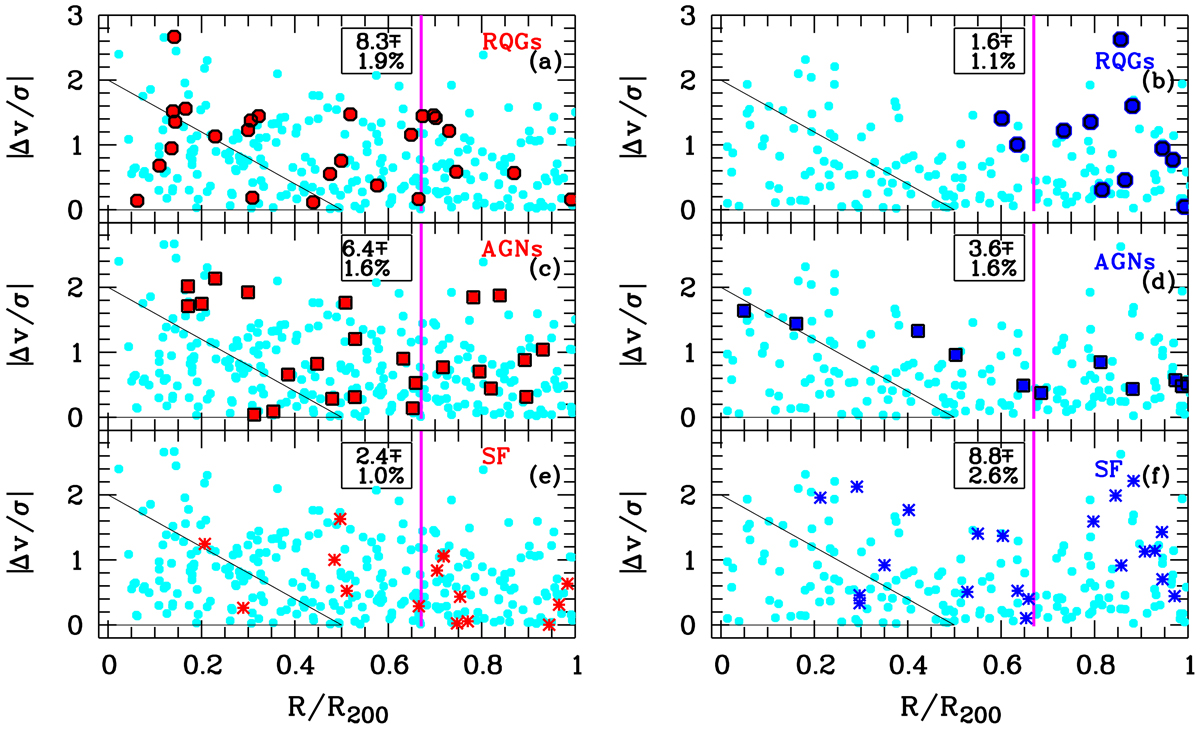
Download original image
Phase-space diagram at R < R200 for nine LoCuSS clusters with passive BCGs (left panels) and nine LoCuSS clusters with active BCGs (right panels). Objects in the Mhigh mass bin are shown, with non-SF galaxies (nonSFgals sample) shown as cyan symbols in all panels, with a higher number of nonSFgals objects with spectroscopy in the nine clusters with passive BCGs (left panels). SF galaxies with star formation traced by their Hα EL (SFgals sample) are shown as asterisks in the lower panels e and f, type-2 AGN are shown as filled squares in the panels c and d, and galaxies which have recently undergone the cessation of their star formation (RQGs), with a SF UV component, but a lack of Hα, are shown by filled circles in the upper panels a and b. The triangle in the lower left-hand corners shows the innermost part of the virialized region as described in the caption of Fig. 3. The magenta vertical line indicates R500. The percentage numbers in each panel are the fractions, within R500, of either SF galaxies, AGN, or RQGs; as indicated in the respective panel, relative to the total number of Mhigh objects inside R500 in the entire spectroscopic sample of nine clusters with either active or passive BCGs, respectively.
Current usage metrics show cumulative count of Article Views (full-text article views including HTML views, PDF and ePub downloads, according to the available data) and Abstracts Views on Vision4Press platform.
Data correspond to usage on the plateform after 2015. The current usage metrics is available 48-96 hours after online publication and is updated daily on week days.
Initial download of the metrics may take a while.