Fig. 2.

Download original image
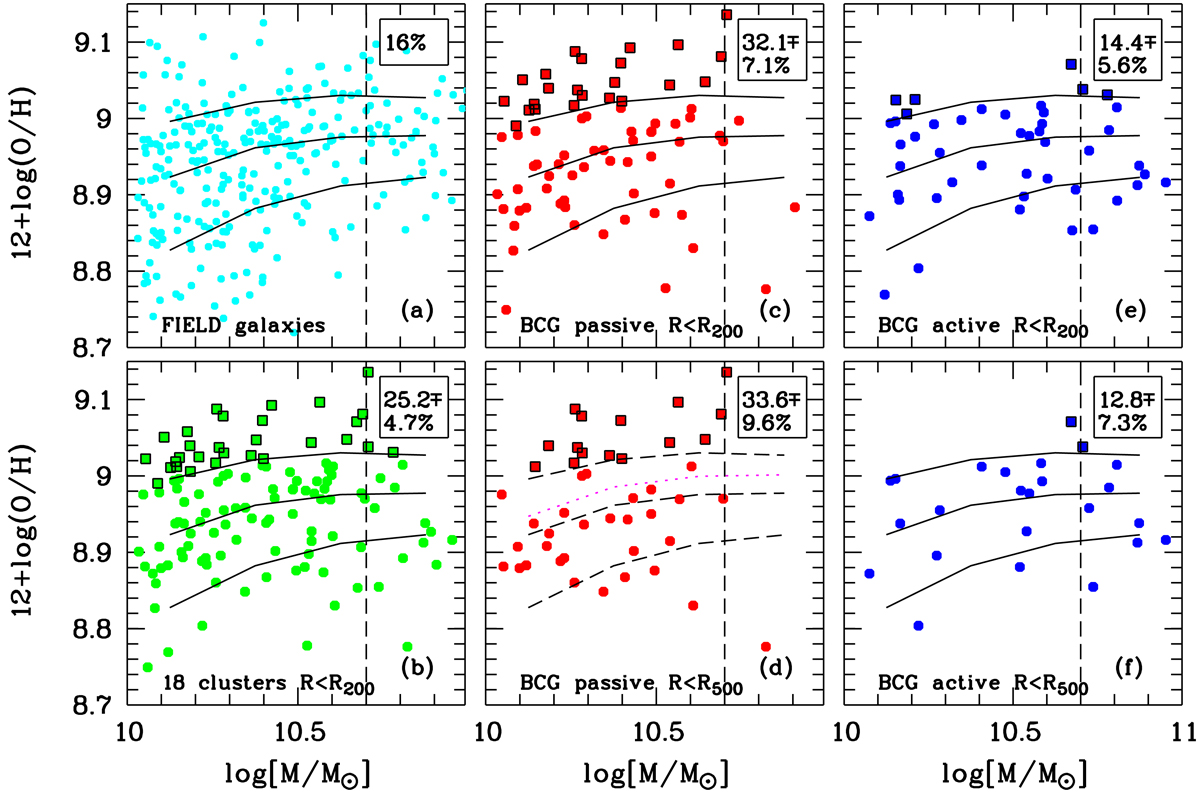
MZR of galaxies with 0.15 < z < 0.26: field galaxies (panel a), cluster galaxies at R < R200 (green symbols in panel b), PBCG cluster galaxies (red symbols in panels c and d) and ABCG cluster galaxies (blue symbols in panels e and f). For the coeval field galaxies in panel a individual measurements are depicted as cyan symbols, while we show 16th and 84th percentiles, and the medians (50th percentiles) of the distribution of O/H values as black lines which we repeat in every panel for comparison to the cluster galaxies. The percentage numbers in each panel indicate the fraction of 10 ≤ log(M/M⊙)≤11 objects with high metallicities, above the 84th percentiles (upper black line) of the field galaxies; the symbols for these high O/H cluster galaxies are additionally framed by black squares. The vertical dashed line shows the division between the Mlow and Mhigh sample. The magenta dotted line in panel d indicates a gap in the PBCGs metallicity distribution between high metallicity and low metallicity objects.
Current usage metrics show cumulative count of Article Views (full-text article views including HTML views, PDF and ePub downloads, according to the available data) and Abstracts Views on Vision4Press platform.
Data correspond to usage on the plateform after 2015. The current usage metrics is available 48-96 hours after online publication and is updated daily on week days.
Initial download of the metrics may take a while.


