Fig. 9
Download original image
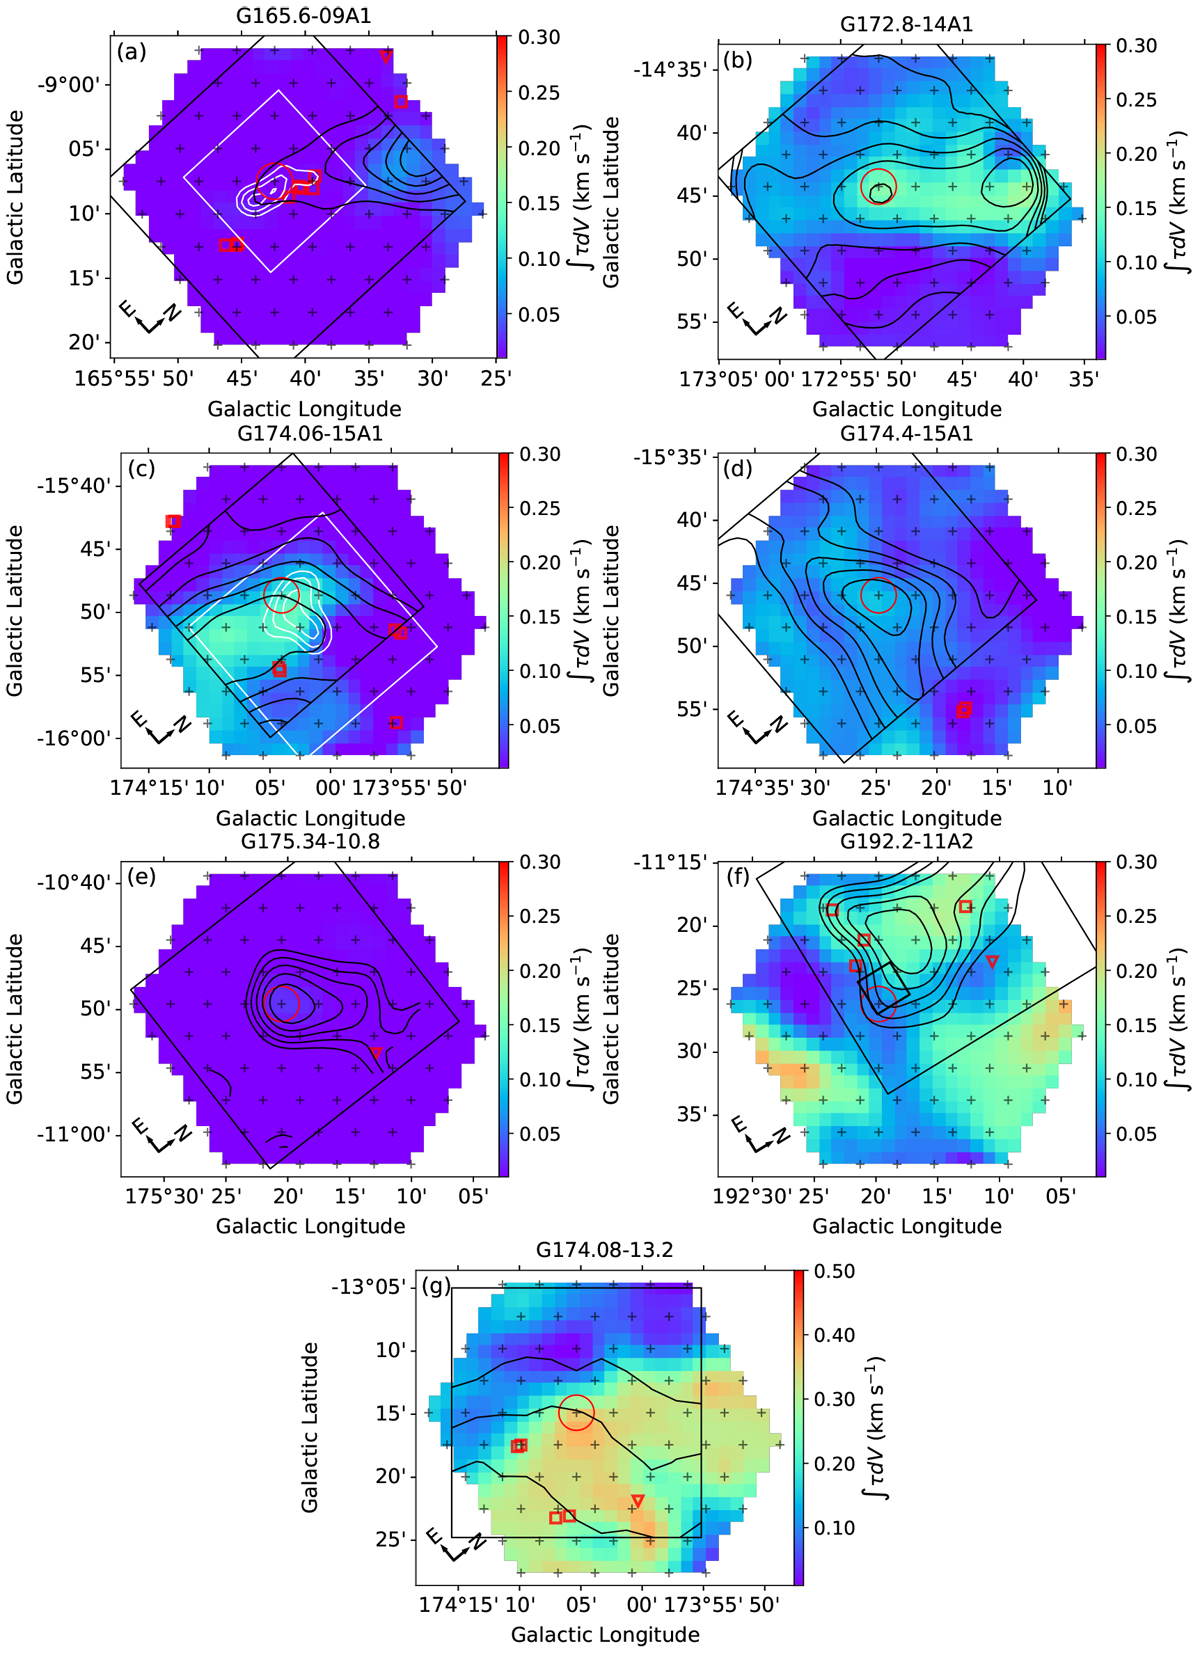
Backgrounds: strengths of HINSA measured in the snapshot mode, extracted using method 2. Black contours: 13CO J = 1–0 emissions, which have been smoothed to the angular resolution of H I observations. Big black boxes: areas covered by CO data. Blue crosses: sampled points of the FAST, and red circle: center beam. Small red boxes and triangles: Class I/II and Class III YSOs. In panels a and c, the white contours represent the emission of C2H N = 1–0 within the white rectangles (Liu et al. 2019). In panel f, the small black rectangle represents the mapped region of the IRAM HCO+ J = 1–0 and C18O J = 2–1 observations, which are shown in Fig. 14.
Current usage metrics show cumulative count of Article Views (full-text article views including HTML views, PDF and ePub downloads, according to the available data) and Abstracts Views on Vision4Press platform.
Data correspond to usage on the plateform after 2015. The current usage metrics is available 48-96 hours after online publication and is updated daily on week days.
Initial download of the metrics may take a while.