Fig. 8
Download original image
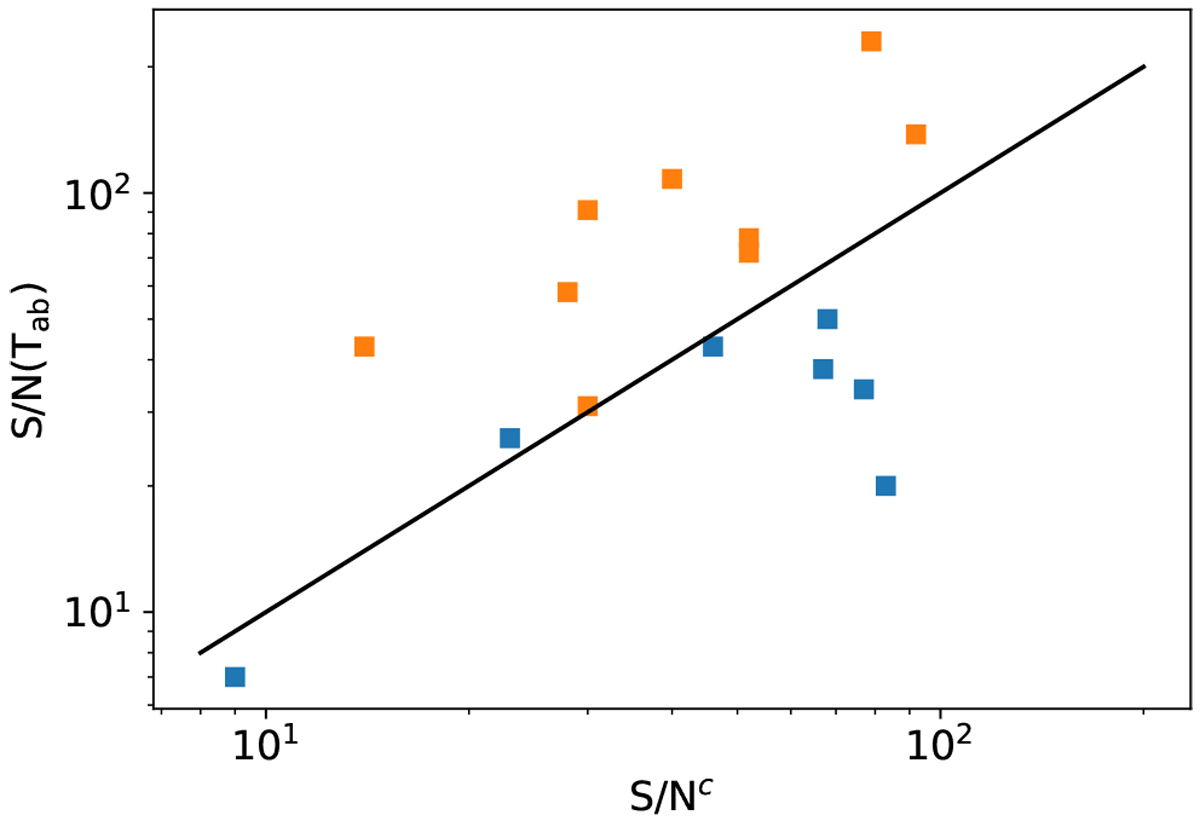
Distribution of S/Nc and S/N(Tab) for the H I spectra of the central beams (Table 3). Here, S/N(Tab) is the ratio between the intensity of absorption dip revealed by method 2 and the spectra noise, and S/Nc is the signal-to-noise threshold required by method 1 (Sect. 5.2.2). The orange and blue squares represent the sources that can and cannot be successfully fit using method 1, respectively. The black line represents x = y. As predicted, the black line is the separation line between the two cases.
Current usage metrics show cumulative count of Article Views (full-text article views including HTML views, PDF and ePub downloads, according to the available data) and Abstracts Views on Vision4Press platform.
Data correspond to usage on the plateform after 2015. The current usage metrics is available 48-96 hours after online publication and is updated daily on week days.
Initial download of the metrics may take a while.